The PowerCLI Dev Team gave us an early XMas present yesterday. They released PowerCLI 4.1.1 build 332441 or PowerCLI 4.1 Update 1 as it is called in the Release Notes.
As usual there is a nice collection of new cmdlets and improvements on existing cmdlets in this new PowerCLI 4.1.1 build. Two of the new cmdlets that jump out for me are the Get-EsxCli and the Get-EsxTop cmdlets.
Although both cmdlets are still marked as ‘experimental’, they both open up a complete new area for automation. In this post I’ll have a closer look at the Get-EsxTop cmdlet and what you can do with it.
Dimitar already gaves us a high-level overview of the Get-EsxTop cmdlet in hist post called ESXTOP Available Through PowerCLI. But how can we actually use this new cmdlet and more importantly, what can we use it for. In this post I documented my initial steps with the Get-EsxTop cmdlet.
From Dimitar’s post we learn that the cmdlet returns three different types of data: counter information, topology information and statistical data.
Counters
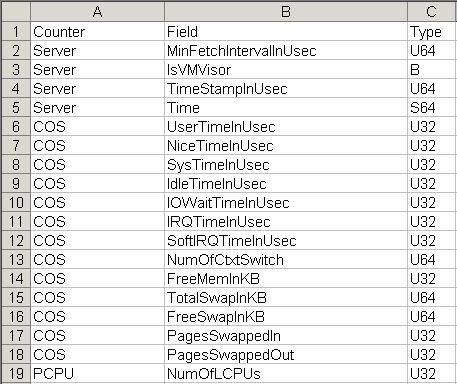
All the counters can be retrieved by using the -Counter parameter. The following short script will produce a CSV file with all the counters that are accessible through the cmdlet.
|
1 2 3 4 5 6 7 8 9 10 11 |
$report = @() foreach($counter in (Get-EsxTop -Counter)){ foreach($field in $counter.Fields){ $row = "" | Select Counter,Field,Type $row.Counter = $counter.Name $row.Field = $field.Name $row.Type = $field.Type $report += $row } } $report | Export-Csv "C:\esxtop-counters.csv" -NoTypeInformation -UseCulture |
This produces a list like this.
In total I found 392 such counters on my ESX 4 server.
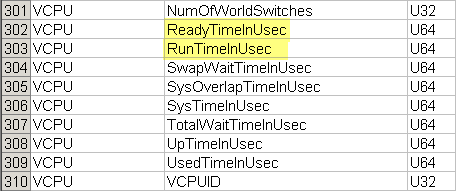
These counters correspond with the columns you see in esxtop. In the list with counters there are a number of fields available for the VCPU counter.
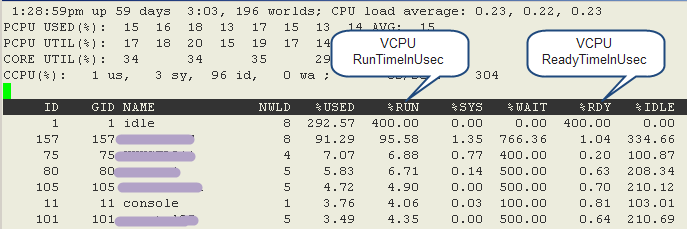
As an example we are going to look for the RunTimeInSec and the ReadyTimeInSec counters in the esxtop page.
We can easily find the corresponding columns on the esxtop page.
Statistical data
Now that we have the name of the counter and the names of the fields we are interested in, we can start retrieving the statistical data.
|
1 |
Get-EsxTop -CounterName VCPU | Select VCPUID,WorldName,RunTimeInUsec,ReadyTimeInUsec | ft -AutoSize |
Easy enough, the data is there.

But we seem to have a couple of problems.
The Values
What kind of values do we see in the RunTimeInUsec and ReadyTimeInUsec columns ?
According to the CSV file with the counters we produced earlier, these fields have U64 values. And the values are cumulative values in microseconds. So we have to calculate the difference between 2 successive sets of values and convert the value to a percentage.
|
1 2 3 4 5 6 7 8 9 10 11 12 13 14 15 16 17 18 19 20 21 22 23 24 |
$esxtopInterval = 5 $conversion = 100 / (1e6 * $esxtopInterval) $first = $true $report = @() for($i = 0; $i -lt 10;$i++){ $stats = Get-EsxTop -CounterName VCPU if(!$first){ $row = "" | Select VCPUID,WorldName,Run,Ready $row.VCPUID = $stats[0].VCPUID $row.WorldName = $stats[0].WorldName $row.run = ($stats[0].RunTimeInUsec - $run) * $conversion $row.ready = ($stats[0].ReadyTimeInUsec - $ready) * 0.00002 $report += $row } else{ $first = $false } $run = $stats[0].RunTimeInUsec $ready = $stats[0].ReadyTimeInUsec sleep $esxtopInterval } $report | ft -AutoSize |
Annotations
Line 1: Esxtop returns values on a 5-seocnd interval
Line 2: The times that are returned are expressed in microseconds. With a simple rule of the three we calculate the conversion factor.
Line 4,8,17: Since we need to calculate the delta value for the 5-seocnd interval we can only produce values from the 2nd set of values onwards.
Line 6: Note that the script does 10 calls to Get-EsxTop and that this will give us values for 9 consecutive intervals
Line 21: Since we only get new data every 5 seconds, the script waits for 5 seonds before retrieving the next set of values.
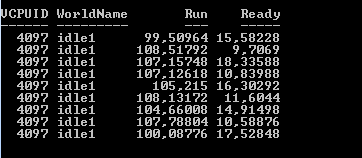
The script returns percentages for both counters.
The result looks like this
The Groups
The next challenge we face is that we don’t see the same names in our output as we see in esxtop. The meaning of the names, like for example idle1, isn’t too obvious.
The explanation on how we can get the same names as we see in esxtop can be found in the document that Duncan rightly calls the Esxtop Bible.
I quote:
Esxtop uses worlds and groups as the entities to show CPU usage. A world is an ESX Server VMkernel schedulable entity, similar to a process or thread in other operating systems. A group contains multiple worlds.
Let’s use a VM as an example. A powered-on VM has a corresponding group, which contains multiple worlds. There is one vcpu (hypervisor) world corresponding to each VCPU of the VM. The guest activities are represented mostly by the vcpu worlds. Besides the vcpu worlds, there are other assisting worlds, such as a MKS world and a VMX world. The MKS world assists mouse/keyboard/screen virtualization. The VMX world assists the vcpu worlds (the hypervisor). The usage of the VMX world is out of the scope of this document. There is only one vmx world for each VM
We need to find all the ‘worlds’ that belong to a VM and group the returned statistical data accordingly.
This brings us to the 3th type of data that Get-EsxTop returns, the topology data. The information concerning your powered-on VMs, the group that represents the VM and the ‘worlds’ inside these groups are available in the SchedGroup topology. There are 26 topologies in total.
In the SchedGroup topology the Entries property is an array where each element represent a specific group. The following lines show all the known groups and for each group the worlds that use a PCPU.
|
1 2 3 4 5 6 7 8 9 |
$topo = Get-EsxTop -TopologyInfo -Topology SchedGroup $topo.Entries | %{ $_.GroupName if($_.CPUCLient){ $_.CPUClient | %{ "`t"+ $_.VCPUName } } } |
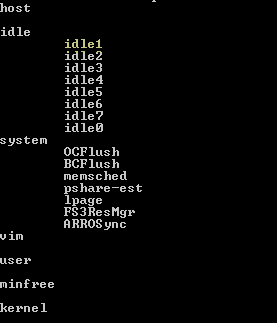
The script produces a rather long list that looks something like this.
Notice the presence of the ‘idle1‘ world, we encountered before, in the ‘idle’ group. This ‘idle1’ world is the idle process that runs on 1 PCPU.
From the ‘idle’ group we can deduce this ESX host has 8 cores, since there will be an idle world for each PCPU.
A group representing a powered-on VM will look something like this.
The VM behind the group vm.12266 has been configured with 1 vCPU while the VM behind the group vm.14696 has been configured with 4 vCPU.
Now as it happens, the number in the name of the group is also the VCPUID number we found in the statistical data since esxtop already makes the summation of the performance data of all the worlds in a group.
Note that this way of finding the VCPUID for a specific VM is quite cumbersome and error-prone.
But that’s where the other new kid on the block comes in quite handy. Meet the Get-EsxCli cmdlet!
As we can read in lamw‘s post called How to obtain GID and LWID from esxtop? it’s quite easy to get the IDs with the esxcli command. And with the information in Pavel’s post called ESXCLI now available through PowerCLI, it’s very simple to get the information we require. The following short script does exactly what we want.
|
1 2 3 |
$vmName = "MyBigVM" $esxcli = Get-EsxCli $esxcli.vms.vm.list() | where {$_.DisplayName -eq $vmName} | Select VMXCartelID |
And this returns.
We can now adapt our earlier script slightly to only show the Run and Ready percentages for a specific powered-on VM.
|
1 2 3 4 5 6 7 8 9 10 11 12 13 14 15 16 17 18 19 20 21 22 23 24 |
$esxtopInterval = 5 $conversion = 100 / (1e6 * $esxtopInterval) $first = $true $report = @() for($i = 0; $i -lt 10;$i++){ $stats = Get-EsxTop -CounterName VCPU | where {$_.VCPUID -eq 14696} if(!$first){ $row = "" | Select VCPUID,WorldName,Run,Ready $row.VCPUID = $stats.VCPUID $row.WorldName = $stats.WorldName $row.run = "{0:p1}" -f (($stats.RunTimeInUsec - $run) * $conversion) $row.ready = "{0:p1}" -f (($stats.ReadyTimeInUsec - $ready) * $conversion) $report += $row } else{ $first = $false } $run = $stats.RunTimeInUsec $ready = $stats.ReadyTimeInUsec sleep $esxtopInterval } $report | ft -AutoSize |
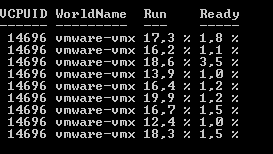
And the result looks like this
Cross-comparing the data with esxtop and the Performance tab in the vSphere Client confirms that the returned data is correct.
That means that we can now get 5-second interval performance data !
As you can imagine this is just the tip of the iceberg, that the Get-EsxTop cmdlet is. I hope to soon produce other posts on the usage of this great new cmdlet !


Dan
Hi LucD,
This is great exactly what I was looking for but I am getting some odd results. The 9 values returned for %RDY time, are a lot higher than what I see during the same period in ESXTOP and through the performance tab of the client. Roughly between 2 – 3 % in ESXTOP, 2.58 in the client and 6 or 7 sometimes much higher using this script. I have confirmed the cartelID is correct for the VM. Oddly, the %RUN looks fine. I am running this against an ESXi 5.0.0 host using PowerCLI 5 also. Is there a reason for the difference that you are aware of or does it run fine for you.
Thanks, Dan
michael
hi, is it possible to provide the vm name directly in the last script. In this example you first lookup the VMXCartelID value. This is entered manually in the last script.
steve
When I run the first script to retrieve the available commands I receive the following error:
An empty pipe element is not allowed.
At :line:4 char:32
+ $row = "" | <<<< Select Counter,Field,Type
Any idea why?
LucD
@Steve. My mistake, something went wrong with the PowerShell code. All double quotes were replaced by HTML code.
It’s corrected now, sorry about that.
jrob24
Luc,
Two things:
1. The vms codeproperty from Get-EsxCLI is not available on 4.0 U2 hosts, only 4.1 hosts.
2. When I ran the final script to determine the Run and Ready %’s for a specific VM, the amounts displayed were much different than what I viewed while watching esxtop. I ran the script against 4.0U2 so not sure if that has anything to do with it. Have you been able to test against different ESX versions?
LucD
Hi Jason.
1. Although not stated explicitly in the PowerCLI 4.1U1 Release Notes, the Get-EsxCli document from Pavel only seems to mention about ESX 4.1.
2. I’m planning on doing some further testing and doing a detailed comparison of the returned values. But I did all my tests on ESX 4.1 and at first sight, the numbers looked ok.
3. They did mention in the Release Notes that both cmdlets are ‘experimental’ 😉
LucD
Hi Jason. An update, the vms property was introduced with ESX 4.1
NiTRo
At last esxtop for windows 🙂
Nice dive Luc, as usual !
Doug B
Awesome! Talk about an early present from LucD, too!
jrob24
Great article. Hope you are able to get some of this in the book 😉
LucD
Thanks. I’ll try to get something in, but don’t hold your breath 🙂