In my previous posts in this series, I showed how you can use metrics to produce statistical reports.
One aspect of the metrics that we haven’t touched till now is the roll up types for metrics. If we look in the PerfCounterInfo object under the rollupType property, we discover that there are several of roll up types available. The enumeration lists the following: average, latest, minimum, maximum, none and summation.
What do all these types mean, and more importantly how do we handle these in our scripts ?
That is the subject of this episode in the statistics series.
Average
This roll up type is rather straightforward. The metric will contain the actual value collected over the interval or the average of the values collected over the interval. Some well-know metrics of this type: cpu.usage.average and mem.active.average.
When we retrieve values from the Realtime interval, we will get the average value of all the values that the ESX(i) server collected in the 20 seconds interval.
An example
|
1 2 3 4 5 6 7 8 9 10 11 12 13 14 15 |
$metrics = "cpu.usage.average","mem.active.average" $entities = Get-VM $start = (Get-Date).AddMinutes(-2) $report = Get-Stat -Entity $entities -Stat $metrics -Realtime -Start $start | ` Group-Object -Property EntityId,Timestamp | %{ New-Object PSObject -Property @{ Name = $_.Group[0].Entity.Name Time = $_.Group[0].Timestamp CpuAvg = ($_.Group | where {$_.MetricId -eq "cpu.usage.average"}).Value MemActAvg = ($_.Group | where {$_.MetricId -eq "mem.active.average"}).Value } } $report | Sort-Object Name,Time | ` Export-Csv "C:\stats.csv" -NoTypeInformation -UseCulture |
Annotations
Line 1: Specify the metrics we want to retrieve
Line 2: Get the entities for which we want to retrieve the statistics
Line 3: Specify the start of the period for which we want to retrieve the data. Since we will not use the Finish parameter, we will get the data from 2 minutes ago till now.
Line 5: We want statistical data from the Realtime interval.
Line 6: Since we want to combine 2 statistical values in 1 row we group the returned data by entity and by timestamp. Each group will thus have 2 entries, one for the CPU metric and one for the memory metric.
Line 10,11: We filter the returned group elements to get respectively the CPU and the memory value.
Nothing fancy about this script. It produces a CSV file that looks something like this.
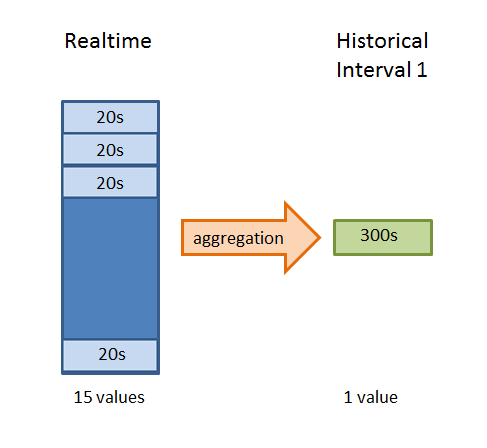
If we go for one of the Historical intervals instead of the Realtime interval, we again get an average value but with a difference. It’s the vCenter aggregation jobs, that calculated the average.
For example, the aggregation job that creates the statistical values for Historical Interval 1, which uses a 300 seconds interval, will take all the Realtime values, which uses a 20 seconds interval, that fall inside the 300 seconds interval and calculate the average. The aggregation job will take 15 Realtime values and calculate 1 Historical Interval 1 value from these.
It’s obvious that this will flatten your values, in other words extreme values, valleys and peaks, will be flattened.
And your data graph will become flatter and flatter, the farther in the Historical Interval series you fetch your data. An example, we collected Realtime values for 1 hour from an ESX(i) server and then we simulate what the aggregation job for Historical Interval 1 is doing. If we graph these 2 data series it becomes obvious what I tried to explain in the previous section.
The following script will retrieve the realtime average write rate for a specific datastore for the last 30 minutes.
|
1 2 3 4 5 6 7 8 9 10 11 12 13 14 15 16 17 18 |
$esxName = "ESXi11.lucd.info" $dsName = "DS10" $metrics = "datastore.write.average" $entities = Get-VMHost -Name $esxName $instance = (Get-Datastore -Name $dsName).Extensiondata.Info.Vmfs.Uuid $start = (Get-Date).AddMinutes(-30) $report = Get-Stat -Entity $entities -Stat $metrics -Realtime -Start $start -Instance $instance | %{ New-Object PSObject -Property @{ VMHost = $_.Entity.Name Datastore = $dsName Time = $_.Timestamp WriteAvg = $_.Value } } $report | Sort-Object Name,Time | ` Export-Csv "C:\dsstats.csv" -NoTypeInformation -UseCulture |
Annotations
Line 6: The datastore.write.average metric uses instances. The instance is the Uuid of the datastore. Note that this way of retrieving the Uuid only works for VMFS datastores.
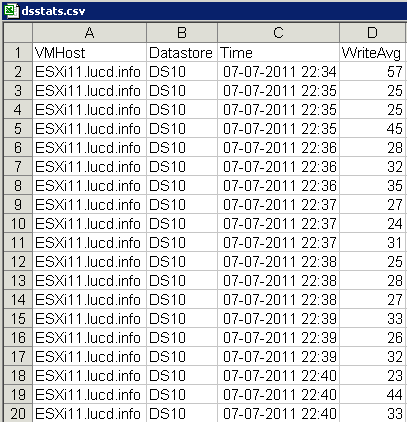
The result is a nice CSV file with the average write rates over 20 seconds intervals.
Now let’s simulate what the aggregation job for Historical Interval 1 doing. And display both series as a graph. For this I used the amazing Out-Chart cmdlet from the PowerGadgets snapin.
|
1 2 3 4 5 6 7 8 9 10 11 12 13 14 |
$stats = Import-Csv "C:\dsstats.csv" -UseCulture 0..($stats.Count/15 - 1) | %{ $avgHI1 = ($stats[($_ * 15)..($_ * 15 + 14)] | ` Measure-Object -Property WriteAvg -Average).Average $stats[($_ * 15)..($_ * 15 + 14)] | ` Add-Member -Name WriteAvgHI1 -Value $avgHI1 -MemberType NoteProperty } $stats | Out-Chart -Values WriteAvg,WriteAvgHI1 -Gallery 3 ` -Title "Write Average" ` -Label {([datetime]$_.Time).toString("mm:ss")} ` -Series_0_Gallery Curve -Series_0_MarkerShape None ` -Series_1_Gallery CurveArea -Series_1_FillMode Solid -Series_1_Color "#F2CD77" |
Annotations
Line 3-8: This loop simulates what the aggregation job is doing, it takes 15 twenty seconds intervals and calculates the average. This is the new average write value for the five minutes interval. To get this in the data array, the script adds a new property, called WriteAvgHI1.
Line 10-15: The Out-Chart cmdlet produces a graph of both series.
The script produces the following graph.
You can see immediately that a lot of the detail in the WriteAvg curve is gone when switching to the WriteAvgHI1 area.
Conclusion: depending on what you want to do with the data, make sure you select the correct interval.
Latest
This roll up type is described as “The most recent value of the performance counter over the summarization period. “.
Let’s have a look at a metric that has this roll up type. As an example I will take the sys.uptime.latest metric, that returns, in seconds, the time since the last system startup. It’s clear that we only want to most recent value for this metric.
|
1 2 3 4 5 6 7 8 |
$metrics = "sys.uptime.latest" $entities = Get-VMHost Get-Stat -Entity $entities -Stat $metrics -Realtime -MaxSamples 1 | ` Select @{N="Host";E={$_.Entity.Name}}, @{N="Time";E={$_.Timestamp}}, @{N="Uptime";E={New-TimeSpan -Seconds $_.Value}} | ` Export-Csv "C:\uptime.csv" -NoTypeInformation -UseCulture |
Annotations
Line 4: Seen the the type of value this metric returns, we definitely want the value form the Realtime interval and we only need 1 value, hence the MaxSamples parameter.
Line 7: The value that is returned is in seconds. Since this unit isn’t very meaningful when dealing with large numbers, the script uses the New-Timespan cmdlet to get a more readable display of the returned value.
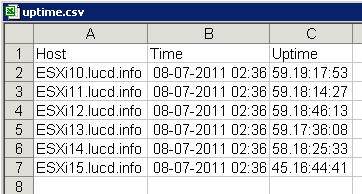
The resulting CSV file looks something like this
The Uptime value is expressed in a dd.hh:mm:ss format through the use of the New-Timespan cmdlet.
A handy metric to include in your regular vSphere reports.
Minimum/Maximum
I handle these roll up types in the same section, since they are essentially the same. And on top of that they are practically the same as the Average roll up type.
Two points to watch out for when you want to work with these roll up types:
- In the Historical Intervals the Minimum and Maximum roll up type metrics are only available when you select Statistics Level 4.
- The aggregation jobs use the average of the minimums and the maximums to calculate the value for the next Historical Interval
Summation
Metrics with this roll up type return the sum of all values of the metric over the interval.
The practical problem here can be that you want to have values over a standardized time unit. For example instead of reporting how many packets were transmitted over a specific vnic during a 20-second interval, you would most probably want to report the value as packets per second.
Not a big deal when using PowerShell as the following short sample will show.
|
1 2 3 4 5 6 7 8 9 10 |
$metrics = "net.packetsTx.summation" $entities = Get-VMHost ESXi11.lucd.info $instance = "vmnic1" $start = (Get-Date).AddMinutes(-5) Get-Stat -Entity $entities -Stat $metrics -Realtime -Instance $instance -Start $start | ` Select @{N="Name";E={$_.Entity.Name}}, @{N="VNIC";E={$_.Instance}}, @{N="Transmit Rate (packets/sec)";E={$_.Value/$_.IntervalSecs}} | ` Export-Csv "C:\TxRate.csv" -NoTypeInformation -UseCulture |
Annotations
Line 9: Notice how the script uses the IntervalSecs that is present in the returned statistical data. This avoids hard-coding these interval values in your scripts.
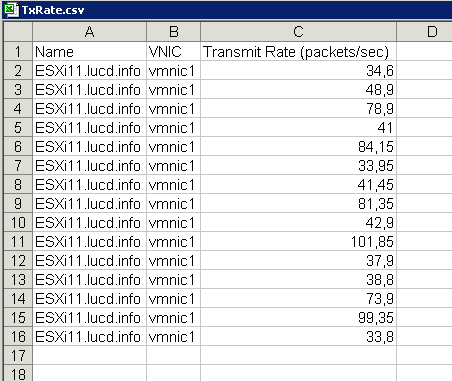
The result looks something like this
None
According to the manual this one is simple, no roll up is done on the metric.
But are there any metrics of this type ? To be honest, I did a search but till now couldn’t find any metric with this roll up type.
If someone knows such a metric, please let me know and I will update this post.


Michael
I’m trying to wrap my head around the differences I’m seeing for cpu.usage.average (on a cluster) when using 5 and 30 minute intervals:
PowerCLI> Get-Stat -Entity “Lab Cluster” -Stat cpu.usage.average -MaxSamples 5 -IntervalMins 30
MetricId Timestamp Value Unit Instance
——– ——— —– —- ——–
cpu.usage.average 1/17/2017 2:30:00 PM 70.1 % *
cpu.usage.average 1/17/2017 2:00:00 PM 70.98 % *
cpu.usage.average 1/17/2017 1:30:00 PM 70.12 % *
cpu.usage.average 1/17/2017 1:00:00 PM 71.57 % *
cpu.usage.average 1/17/2017 12:30:00 PM 68.89 % *
PowerCLI C:\Program Files (x86)\VMware\Infrastructure\vSphere PowerCLI> Get-Stat -Entity “Lab Cluster” -Stat cpu.usage.average -MaxSamples 40 -IntervalMins 5
MetricId Timestamp Value Unit Instance
——– ——— —– —- ——–
cpu.usage.average 1/17/2017 3:15:00 PM 128.39 % *
cpu.usage.average 1/17/2017 3:10:00 PM 128.32 % *
cpu.usage.average 1/17/2017 3:05:00 PM 147.88 % *
cpu.usage.average 1/17/2017 3:00:00 PM 138.19 % *
cpu.usage.average 1/17/2017 2:55:00 PM 137.52 % *
cpu.usage.average 1/17/2017 2:50:00 PM 133.04 % *
cpu.usage.average 1/17/2017 2:45:00 PM 146.27 % *
cpu.usage.average 1/17/2017 2:40:00 PM 133.68 % *
cpu.usage.average 1/17/2017 2:35:00 PM 147.52 % *
cpu.usage.average 1/17/2017 2:30:00 PM 134.66 % *
cpu.usage.average 1/17/2017 2:25:00 PM 141.3 % *
cpu.usage.average 1/17/2017 2:20:00 PM 137.43 % *
cpu.usage.average 1/17/2017 2:15:00 PM 146.43 % *
cpu.usage.average 1/17/2017 2:10:00 PM 132.55 % *
cpu.usage.average 1/17/2017 2:05:00 PM 139.41 % *
cpu.usage.average 1/17/2017 2:00:00 PM 146.23 % *
cpu.usage.average 1/17/2017 1:55:00 PM 145.77 % *
cpu.usage.average 1/17/2017 1:50:00 PM 139.16 % *
cpu.usage.average 1/17/2017 1:45:00 PM 146.87 % *
cpu.usage.average 1/17/2017 1:40:00 PM 137.66 % *
cpu.usage.average 1/17/2017 1:35:00 PM 133.22 % *
cpu.usage.average 1/17/2017 1:30:00 PM 130.28 % *
cpu.usage.average 1/17/2017 1:25:00 PM 135.37 % *
cpu.usage.average 1/17/2017 1:20:00 PM 142.38 % *
cpu.usage.average 1/17/2017 1:15:00 PM 146.92 % *
cpu.usage.average 1/17/2017 1:10:00 PM 134.11 % *
cpu.usage.average 1/17/2017 1:05:00 PM 146.49 % *
cpu.usage.average 1/17/2017 1:00:00 PM 145.22 % *
cpu.usage.average 1/17/2017 12:55:00 PM 135.99 % *
cpu.usage.average 1/17/2017 12:50:00 PM 131.27 % *
cpu.usage.average 1/17/2017 12:45:00 PM 143.43 % *
cpu.usage.average 1/17/2017 12:40:00 PM 132.54 % *
cpu.usage.average 1/17/2017 12:35:00 PM 132.39 % *
cpu.usage.average 1/17/2017 12:30:00 PM 142.56 % *
cpu.usage.average 1/17/2017 12:25:00 PM 132.32 % *
cpu.usage.average 1/17/2017 12:20:00 PM 133.5 % *
cpu.usage.average 1/17/2017 12:15:00 PM 136.47 % *
cpu.usage.average 1/17/2017 12:10:00 PM 143.33 % *
cpu.usage.average 1/17/2017 12:05:00 PM 146.4 % *
cpu.usage.average 1/17/2017 12:00:00 PM 148.41 % *
How can the 5 minute interval values be so consistently higher than the 30 minute values?
Tara
Hi, I am trying to figure out which units of measurement are used for the min,max and average memory and cpu values from the PowerCLI scripts?
Thank you in advance.
LucD
Hi Tara,
Each counter has a Unit property.
$vm = get-vm -Name MyVM

$stat = 'cpu.usage.average'
Get-Stat -Entity $vm -Stat $stat -Realtime -MaxSamples 1 | select -Property MetricId,Unit
You can also create a Reference Sheet, see the 2nd script in Dutch VMUG: The Statistics Reporting Session.
Hope this helps
Francesco
Hi all,
good script! But I want to know how can extract a CPU ready value at a specifica hour. I want to retrieve, for example, the CPU Ready of a VM at 12:00 AM. How can do this?
Thanks!
Francesco
noam
This question may be trivial, but I’m curious. For stats over the last week, it seems more granular data is available using the last 6.78 days as opposed to last 7 days. For example,
this returns 323 data points
get-vm someName | get-stat -stat cpu.usageMHz.average -start (get-date).addDays(-6.78) | measure-object | select count
and this returns only 80 data points:
get-vm someName | get-stat -stat cpu.usageMHz.average -start (get-date).addDays(-6.9) | measure-object | select count
In practice, the differences are probably negligible when using averages. But when rounding precision is a higher priority than script completion time or the inclusion of the week’s first 316.8 minutes… maybe it’s better to measure the last 6.78 days instead of last 7?
LucD
There are no trivial questions 🙂
What you notice is a consequence of the aggregation jobs that run on the vCenter database. Every week there runs an aggregation job that takes the statistics from Historical Interval 2 and “aggregates” them into statistics for Historical Interval 3.
Depending on the time when this aggregation job runs on your database server you will not see the full 7 days worth of Historical Interval 2 data.
A couple of minutes before this job runs you will see the most datapoints.
If you need a granularity of the Historical Interval 2 time interval, you will have to collect the data yourself. Every 6 days would be the maximum interval to run this collection job.
Chris
I am new to PowerCLI. I am attempting to generate a CSV file with CPU Min/Max/Ave, Memory Min/Max/Ave, Disk Latency Min/Max/Av, and Network Through Put Min/Max Av for the previous day with 5 minute intervals so we can import the data into our corporate data repository.
Most of the scripts that I have run across is using RealTime stats but I am looking for previous day stats.
Luke
Excellent, thank you very much. I will play around with sending batch calls with the get-stat cmdlet. One final question, in the script above cpu.ready.summation, disk.maxtotallatency.latest, and cpu.corecount.contention.average do not yield any results. This seems to be because these statistics aren’t available at the host level, rather only at the vm level. However when I do a simple Get-Stat -Entity ($vmHost) -stat cpu.ready.summation call it yields results. I can’t seem to locate the cause of this discrepancy, or find a way to integrate these statistics into the above script.
Thanks again for all your work, you have written literally half of every useful powercli post I have read, and helped me a lot in my quest.
LucD
@Luke, you can find which metrics are available for which entity through the PerformanceManager page in the SDK Reference.
I just checked and cpu.ready.summation for example, is available for VMs and hosts.
On the other hand, cpu.corecount.contention.average is only available for ResourcePools.
You can also check which metrics are available for a specific entity and for a specific interval with the Get-StatType cmdlet.
For example
Get-StatType -Entity $esx -Start $start | Sort-Object -Unique
The Sort with the Unique parameter is there to avoid displaying the same metric multiple times when it is captured for all instances.
It could be that the interval for which you request the data, the Start parameter, doesn’t keep this metric. It depends on the Statistics Level you have defined for that Historical Interval.
luke
quick question: I have the following script to output daily host information. Most of this I have adapted from your work, which has been very helpful.
My question is about how the code scales, for six hosts it runs in under three minutes, but for 90 hosts it is hung up and takes many hours. How can I scale this kind of code to a few hundred hosts?
Thank you in advance
$script:startTime = get-date
$report = @()
$metrics = “cpu.usage.average”, “cpu.ready.summation”, “cpu.corecount.contention.average”, “mem.usage.average”, “mem.capacity.usage.average”, “mem.consumed.average”, “disk.maxTotalLatency.latest”, “net.usage.average”
$vmhosts = get-vmhost
$todayMidnight = (Get-Date -Hour 0 -Minute 0 -Second 0).AddMinutes(-1)
Get-Stat -Entity ($vmhosts) -Start $todayMidnight.AddDays(-1) -Finish $todayMidnight -stat $metrics -intervalmins 5 | `
Group-Object -Property {$_.Entity.Name, $_.TimeStamp.Hour} | %{
$row = “”| Select vmHost, Timestamp, MinCpu, AvgCpu, MaxCPU, Avgcpuready, Avgcpucores, minmem, avgmem, maxmem, minmemcap, avgmemcap, maxmemcap, minmemconsumed, avgmemconsumed, maxmemconsumed, mindisklatency, avgdisklatency, maxdisklatency, minnetusage, avgnetusage, maxnetusage
$row.VmHost = $_.Group[0].Entity.Name
$row.Timestamp = ($_.Group | Sort-Object -Property Timestamp)[0].Timestamp
$cpuStatusage = $_.Group | where {$_.MetricId -eq “cpu.usage.average”} | Measure-Object -Property Value -Minimum -Maximum -Average
$row.MinCpu = “{0:f2}” -f ($cpuStatusage.Minimum)
$row.AvgCpu = “{0:f2}” -f ($cpuStatusage.Average)
$row.MaxCpu = “{0:f2}” -f ($cpuStatusage.Maximum)
$cpuStatready = $_.Group | where {$_.MetricId -eq “cpu.ready.summation”} | Measure-Object -Property Value -Average
#$row.Mincpuready = “{0:f2}” -f ($memStatready.Minimum)
$row.Avgcpuready = “{0:f2}” -f ($memStatready.Average)
#$row.Maxcpuready = “{0:f2}” -f ($memStatready.Maximum)
$cpuStatcores = $_.Group | where {$_.MetricId -eq “cpu.corecount.contention.average”}| Measure-Object -Property Value -Average
#$row.Mincpucores = “{0:f2}” -f ($memStatcores.Minimum)
$row.Avgcpucores = ($memStatcores.Average)
#$row.Maxcpucores = “{0:f2}” -f ($memStatcores.Maximum)
$memStatusage = $_.Group | where {$_.MetricId -eq “mem.usage.average”} | Measure-Object -Property Value -Minimum -Maximum -Average
$row.MinMem = “{0:f2}” -f ($memStatusage.Minimum)
$row.AvgMem = “{0:f2}” -f ($memStatusage.Average)
$row.MaxMem = “{0:f2}” -f ($memStatusage.Maximum)
$memStatcap = $_.Group | where {$_.MetricId -eq “mem.capacity.usage.average”} | Measure-Object -Property Value -Minimum -Maximum -Average
$row.MinMemcap = “{0:f2}” -f ($memStatcap.Minimum)
$row.AvgMemcap = “{0:f2}” -f ($memStatcap.Average)
$row.MaxMemcap = “{0:f2}” -f ($memStatcap.Maximum)
$memStatconsumed = $_.Group | where {$_.MetricId -eq “mem.consumed.average”} | Measure-Object -Property Value -Minimum -Maximum -Average
$row.MinMemconsumed = “{0:f2}” -f ($memStatconsumed.Minimum)
$row.AvgMemconsumed = “{0:f2}” -f ($memStatconsumed.Average)
$row.MaxMemconsumed = “{0:f2}” -f ($memStatconsumed.Maximum)
$diskstatlatency = $_.Group | where {$_.MetricId -eq “disk.maxTotalLatency.latest”} | Measure-Object -Property Value -Minimum -Maximum -Average
$row.maxdisklatency = ($memStatlatency.Minimum)
$row.Avgdisklatency = ($memStatlatency.Average)
$row.Maxdisklatency = ($memStatlatency.Maximum)
$netstatusage = $_.Group | where {$_.MetricId -eq “net.usage.average”} | Measure-Object -Property Value -Minimum -Maximum -Average
$row.Minnetusage = “{0:f2}” -f ($memStatusage.Minimum)
$row.Avgnetusage = “{0:f2}” -f ($memStatusage.Average)
$row.Maxnetusage = “{0:f2}” -f ($memStatusage.Maximum)
$report += $row
}
$report | export-csv “rally.txt” -noTypeInformation
$elapsedTime = new-timespan $script:StartTime $(get-date)
write-host $elapsedTime
LucD
@Luke, to scale I would not get the statistics for all hosts in 1 Get-Stat call. Split them up in batches of 10 or 20 for example.
You could eventually launch these batches in the background with the Start-Job cmdlet. Watch out, a background job requires special actions to run PowerCLI cmdlets. You will have to load for example the PowerCLI snapin in each of the background jobs.