
After Part 1 – The Basics in this series, I will show in Part 2 how you can set up Tintri’s VM Protection through Replication. And to conclude this post I will show some Reporting that you can do with the Tintri Automation Toolkit.
VM Protection with per-VM replication
One of the great features of Tintri VMstore is per-VM replication and the ease of setting up such replication for a VM between multiple VMstores.
The concept is quite simple:
- Schedule snapshots of the VM
- Specify where to replicate the VM
Instead of doing this through the VMstore Dashboard, we can now do this with the Tintri module Cmdlets. This means that can you now set up Replication as part of your automated VM deployment process.
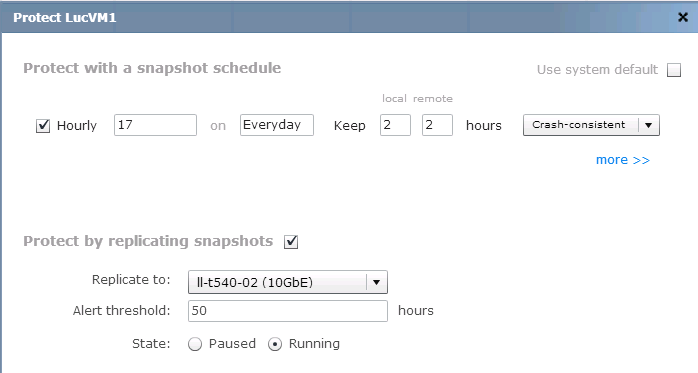
The following script sets up replication for a specific VM.
|
1 2 3 4 5 6 7 8 9 10 11 12 13 14 15 16 17 18 |
$vm = Get-TintriVM -Name $vmName $tvmSnapSched = @{ VM = $vm SnapshotScheduleType = [Tintri.Windows.RA.V110.Dto.VirtualMachineSnapshotScheduleType]::HOURLY MinuteOnTheHour = "17" SnapshotConsistency = "CRASH_CONSISTENT" RetentionHoursLocal = 2 RetentionHoursRemote = 2 } $sched = New-TintriVMSnapshotSchedule @tvmSnapSched Set-TintriVMSnapshotSchedule -VM $vm -SnapshotSchedule $sched $rpPref = "ll-t540-02 (10GbE)" $rp = Get-TintriDatastore | Get-TintriDatastoreReplPath | where {$_.DisplayName -eq $rpPref} New-TintriVMReplConfiguration -VM $vm -DatastoreReplPath $rp |
The Snapshot schedule that is created will take a snapshot every hour and retains the last snapshots.
The replication path (a combination of the source IP address/port and the destination IP address/port) is selected based on the path name, which is user defined as the VMstore administrator creates the path.
When the above script is executed replication for the VM becomes active. We can easily check this through a PowerShell script.
|
1 2 |
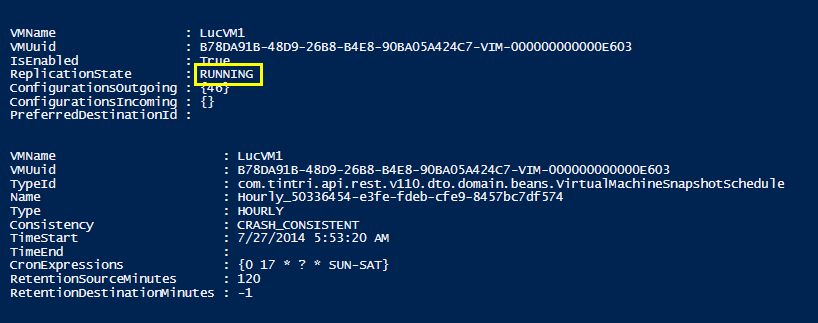
Get-TintriVMReplConfiguration -VM $vm Get-TintriVMSnapshotSchedule -VM $vm | where {$_.RetentionSourceMinutes -eq 120} |
The output
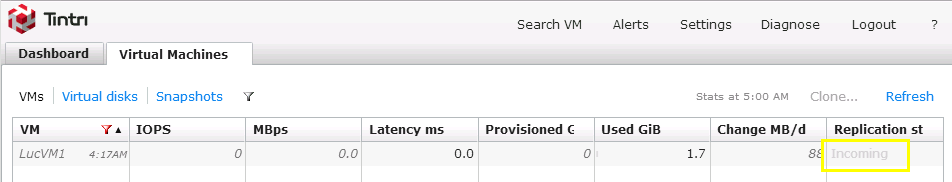
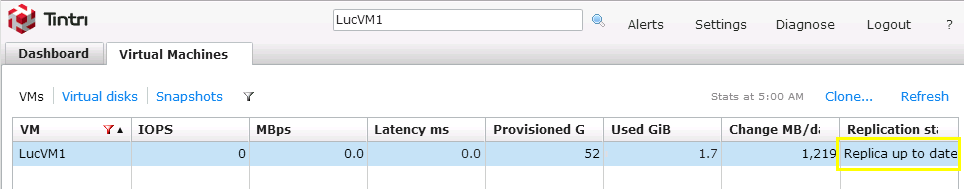
We can of course also check that the replication setup is functioning via the Dashboard.
The snapshotting uses the schedule we provided.
On the source VMstore we see that the Replica is created.
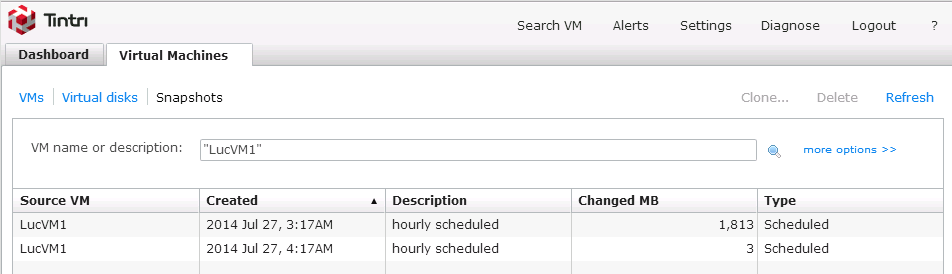
On the destination VMstore we see the snapshots of the VM.
Reporting with the Tintri Automation Toolkit
Part of an administrator’s job, is to produce regular status reports on the environments he or she manages. The Tintri Automation Toolkit comes loaded with a number of Cmdlets that allow for retrieving status information through PowerShell scripts.
Just a few examples below.
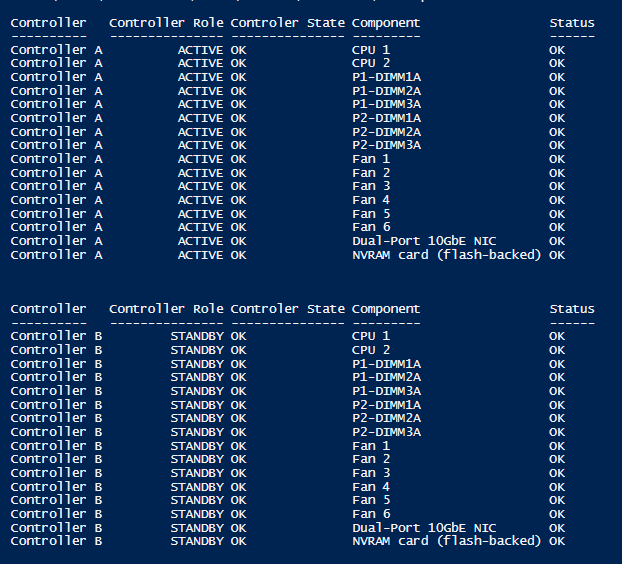
This script provides the status of both controllers on a VMstore (which has redundant controllers) and their components.
|
1 2 3 4 5 6 7 8 |
$appl = Get-TintriAppliance -TintriServer $srv1 foreach($controller in $appl.Controllers){ $controller.Components | Select @{N="Controller";E={$controller.Locator}}, @{N="Controller Role";E={$controller.Role}}, @{N="Controler State";E={$controller.State}}, @{N="Component";E={$_.Locator}}, @{N="Status";E={$_.Status}} | Format-Table -AutoSize } |
The script produces the following output
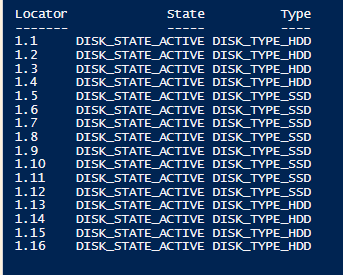
The following script provides location and type of the disks in a VMstore.
|
1 2 |
$appl = Get-TintriAppliance -TintriServer $srv1 $appl.Disks | Select Locator,State,Type | Format-Table -AutoSize |
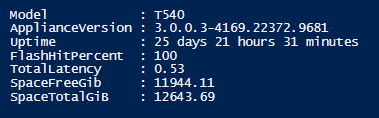
With the Get-TintriDashboard cmdlet you have access to the same information that is displayed in the Dashboard web interface.
|
1 2 |
Get-TintriDashboard -HostName $srv1.ApplianceHostName | Select Model,ApplianceVersion,Uptime,FlashHitPercent,TotalLatency,SpaceFreeGib,SpaceTotalGib |
And my favorite, access to all kinds of performance figures through the Get-TintriDatastoreStat and Get-TintriVMStat Cmdlets.
The following script, for example, extracts the latency counters for a specific VM, and then uses the Export-Xlsx function to produce a spreadsheet with a chart included.
|
1 2 3 4 |
Get-TintriVM -Name $vmName | Get-TintriVMStat -IncludeHistoricStats | Select TimeStartMs,LatencyHostMs,LatencyNetworkMs,LatencyStorageMs,LatencyDiskMs | Export-Csv report.csv -NoTypeInformation |
The resulting spreadsheet looks something like this
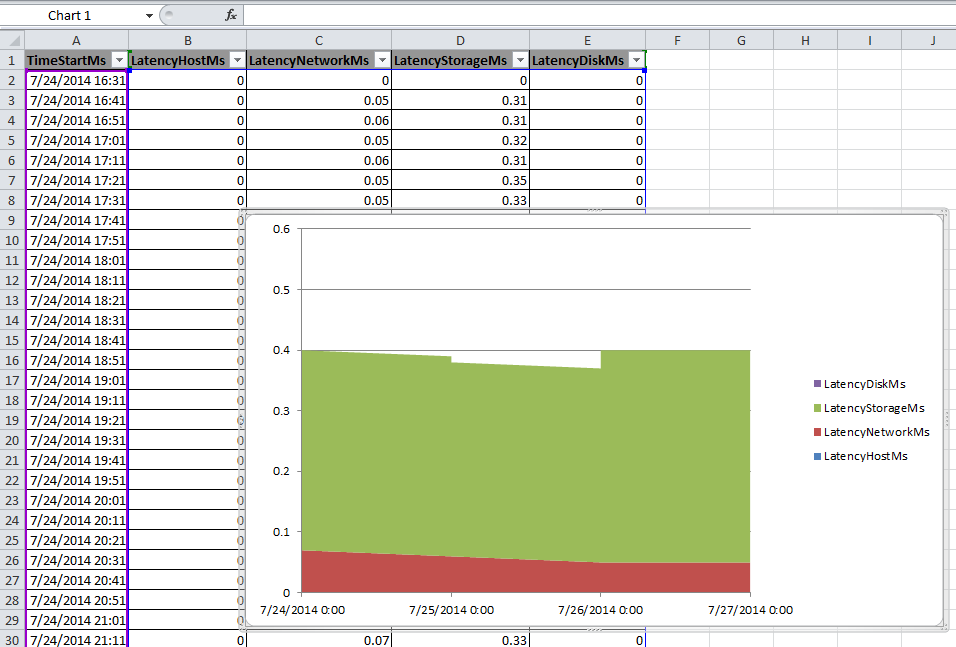
Note that a VMstore keeps 7 days of statistical data, each sample for a 10 minute interval. These are the same exact graphs available from the VMstore UI.
The chart was produced with the Export-Xlsx function.
Conclusion
In conclusion, this 1st version of the Tintri Automation Toolkit brings an extensive set of Cmdlets to manage your Tintri VMstore(s). If you want to automate your VMstore actions, I will definitely advise to give the Tintri Automation Toolkit a try.
Thanks to all the good people at Tintri who gave me the opportunity and access to their lab to explore the Tintri Automation module.
Enjoy !