
In PowerCLI & vSphere statistics – Part 1 – The basics I briefly mentioned instances. In this post I’ll go a bit deeper into that subject.
And to demonstrate it all I will use part of the esxtop post on Yellow Bricks. In that post Duncan compiled, from various sources, a number of “common sense” thresholds that you can use in esxtop to show you possible problems with your hosts and/or guests.
Since I’m not sitting 24/7 behind an ESX/ESXi console, I looked for a way to let PowerCLI/PowerShell do that for me 😉
First some “watch out” remarks for the solution I came up with.
- esxtop uses some metrics that are not available via the Get-Stat cmdlet. The script doesn’t aim to replace esxtop to pinpoint potential problems.
- esxtop uses a 5 second interval. The Realtime interval with 20 seconds is the shortest available and Historical Interval 1 is even 5 minutes. Consequentially short-lived spikes will hardly be visible in the report the script produces.
Does this mean the script has no real value ?
Not really, it will
- show you possible problem areas in your environment with a rough indication of the time when they took place. This will help you in deciding when to look at the details with esxtop.
- It will also come in handy when someone drops by your office and claims their guest had a problem half an hour ago 😉
From the tresholds Duncan published in his article I will, in this post, only look at the disk-related metrics.
First check, can we get all the metrics that esxtop shows ?
Yes, we can get most of them.
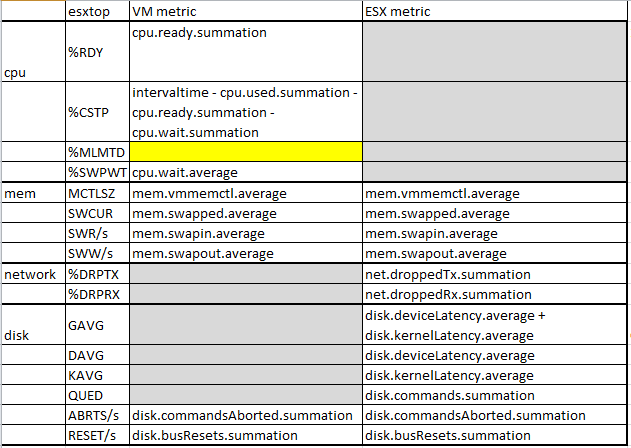
To start with I compiled a worksheet with the esxtop fields and the corresponding metrics. As you can notice, some esxtop fields require calculations when we try to emulate them with performance metrics.

Luckily the disk-related values all have corresponding metrics.
As you probably know most of the disk metrics come with an instance that is displayed in the vSphere client as the Identifier field.

If your have multi-pathing, your LUNs/disks can be reached over more than one path. Which path is taken depends on what you defined in the Path selection policy. It can be Fixed, Round robin or Most recently used.
In esxtop you can see the values per adapter

but also per disk device

In this script I will try to emulate the adapter view. Since the values returned by the Get-Stat cmdlet are per instance, the script will have to add the values of all instances together to emulate the esxtop adapter view.
The user should be able to specify the adapter(s) (vmhba2 for example in the screenshot) he is interested in. It is up to the script to find out which LUN instances pass through the adapter(s).
Unfortunately the Get-ScsiLun and Get-ScsiLunPath cmdlets, as far as I know, don’t allow you to make the link between an adapter and its LUN instances. That means we will have to dive into the SDK.
For an ESX host the HostStorageDeviceInfo object allows you to find these links. It’s a matter of following the links, using the keys and placing all the instances in one or more arrays.
As a side-remark, in the test setup I used a “Fixed” Path Selection policy. This is done to show that different instances (devices) can have a path over different adapters. In reality I normally use the “Round robin” policy.
The problem with the “Round robin” policy is that all paths will be marked as “active“. That means that the “adapter” concept becomes irrelevant. For example if you run the script with two adapter selected, all the instances will be mapped to the first adapter you specified.
|
1 2 3 4 5 6 7 8 9 10 11 12 13 14 15 16 17 18 19 20 21 22 23 24 25 26 27 28 29 30 31 32 33 34 35 36 37 38 39 40 41 42 43 44 45 46 47 48 49 50 51 52 53 54 55 56 57 58 59 60 61 62 63 64 65 66 67 68 69 70 71 72 73 74 75 76 77 78 79 80 81 82 83 84 85 86 87 88 89 |
$esxName = "My-ESX-server" $tgtAdapters = "vmhba2","vmhba4" $metrics = "disk.deviceLatency.average","disk.kernelLatency.average", "disk.queueLatency.average","disk.commandsAborted.summation", "disk.busResets.summation" $esxImpl = Get-VMHost -Name $esxName $esx = $esxImpl | Get-View $endDate = Get-Date $startDate = $endDate.AddHours(-1) # # Find active instances per selected adapter $instances = @{} $instancesFilter = @() foreach($adapter in $tgtAdapters){ $adapterInstances = @() $adapterKey = ($esx.Config.StorageDevice.HostBusAdapter | where {$adapter -eq $_.Device}).Key foreach($lun in $esx.Config.StorageDevice.MultipathInfo.Lun){ foreach($path in $lun.Path){ if($path.Adapter -eq $adapterKey -and $path.PathState -eq "active"){ foreach($scsiLun in $esx.Config.StorageDevice.ScsiLun){ if($scsiLun.Key -eq $lun.lun){ $adapterInstances += $scsiLun.CanonicalName $instancesFilter += $scsiLun.CanonicalName } } } } } $instances[$adapter] = $adapterInstances } # Get statistics for instances $stats = Get-Stat -Entity $esxImpl -Stat $metrics -Start $startDate -Finish $endDate | ` where {$instancesFilter -contains $_.Instance} # Create the reporting array $hbaTab = @{} $stats | %{ # Determine HBA-name based on instance $instance = $_.Instance $instances.GetEnumerator() | %{ if($_.Value -contains $instance){$currentHba = $_.Name} } # Gethash table for adapter if($hbaTab.ContainsKey($currentHba)){ $timeTab = $hbaTab[$currentHba] } else{ $timeTab = @{} } # Check if there is a row for this timestamp if($timeTab.ContainsKey($_.Timestamp)){ $row = $timeTab[$_.Timestamp] } else{ $row = New-Object PSObject -Property @{ Time = $_.Timestamp Interval = 0 GAVG = 0 DAVG = 0 KAVG = 0 QUED = 0 ABRT = 0 RESET = 0 } } $row.Interval = $_.IntervalSecs $value = $_.Value switch($_.MetricId){ "disk.deviceLatency.average"{$row.DAVG += $Value} "disk.kernelLatency.average"{$row.KAVG += $Value} "disk.queueLatency.average"{$row.QUED += $Value} "disk.commandsAborted.summation"{$row.ABRT += $Value} "disk.busResets.summation"{$row.RESET += $Value} } $timeTab[$_.Timestamp] = $row $hbaTab[$currentHba] = $timeTab } $hbaTab.GetEnumerator() | %{ $_.Value.GetEnumerator() | %{ $_.Value.GAVG = $_.Value.DAVG + $_.Value.KAVG $_.Value.ABRT /= $_.Value.Interval $_.Value.RESET /= $_.Value.Interval } $_.Value.Values | Sort-Object -Property Time | ` Export-Csv ("C:\IO-stat-" + $esxName.Split(".")[0] + "-" + $_.Name + ".csv") -NoTypeInformation -UseCulture } |
Annotations
Line 1-2: the input, specify a host and the adapters you’re interested in
Line 3-5: the metrics that are needed to map the esxtop fields
Line 10-11: to have any practical value the metrics should be requested from the Realtime interval.
Line 13-32: gets the “active” instances for each adapter that was selected
Line 38: the reporting array is composed of two nested hash tables. I used hash tables because that makes it easy to find back the entries (by key).
Line 39: the outer hash table uses the adaptername as the key
Line 53: the inner hash table uses the timestamp as the key
Line 71-77: all the returned metrics for a specific timestamp are stored (as a summation) in the $row variable
Line 83-85: post processing of some of the acquired numbers
Line 88: a CSV file per adapter
The script produces one CSV file per adapter you specified. In the CSV file you see the values for the metrics (same headers as esxtop). Unfortunately I wasn’t able to stress my SAN components sufficiently to show some higher numbers for the latencies and to have some non-zero number in the QUED column.

Note that you most probably will have to change the format of the Time column in Excel to see the seconds.
To conclude, do not use this to replace esxtop ! But use it to see some trends, repeating patterns….
Jason Weaver
Getting multiple errors:
Get-Stat : 8/22/2014 10:15:27 AM Get-Stat The metric counter “disk.kernellatency.average” doesn’t exist for entity “”.
At H:\scripts\get_esxtop.ps1:37 char:18
+ $stats = Get-Stat <<<< -Entity $esxImpl -Stat $metrics -Start $startDate -Finish $endDate | `
+ CategoryInfo : ResourceUnavailable: (disk.kernellatency.average:String) [Get-Stat], VimException
+ FullyQualifiedErrorId : Client20_RuntimeDataServiceImpl_CheckUserMetrics_MetricDoesntExist,VMware.VimAutomation.ViCore.Cmdlets.Commands.GetViStats
That would make it line 35 in your script.
LucD
Hi Jason,
It looks as if the counter is not available for that specific entity in that specific timeframe.
Which time period, and hence Historical Interval, did you select ?
Is your vCenter set to at least statistics level 2 for that Historical Interval ?
hermouet
hi Luc
nice script. good job.
Line 10-11: to have any practical value the metrics should be requested from the Realtime interval.
when i export my value from past day it change to every 30min and not every 2min. so theire is mean to change this and export all value every 2mn ? next i import on database and work with that
tks
kevin
@LucD
i am testing get-stat2 for disk info
right now it is throwing an error on this line in get-stat2
$metricId = $perfMgr.QueryAvailablePerfMetric($Entity.MoRef,$null,$null,$numinterval)
error is ………… (this is way beyond my .net expertise)
Exception calling “QueryAvailablePerfMetric” with “4” argument(s): “entity”
At C:\Windows\TEMP\eaaaeeed-d3dc-4367-968b-6ebfe4e88a60.ps1:154 char:50
+ $metricId = $perfMgr.QueryAvailablePerfMetric <<<< ($Entity.MoRef,$null,$null,$numinterval)
+ CategoryInfo : NotSpecified: (:) [], MethodInvocationException
+ FullyQualifiedErrorId : DotNetMethodException
kevin
also, it doesn’t look like the counters exist when connecting to a vcenter. Get-Stat : 1/30/2012 3:25:11 PM Get-Stat The metric counter “disk.devicelatency.average” doesn’t exist for entity “ltlesxvts15.loutap.loutms.tree”.
At C:\Downloads\vmware\scripts\latency report.ps1:57 char:19
@LucD
LucD
@Kevin, I’m afraid the Get-Stat cmdlet is a bit flawed for the disk metrics.
The bypass is to use the Get-Stat2 function from my Datastore usage statistics post.
With that function you first do
Get-Stat2 -entity $esx -interval "HI1" -Stat "disk.deviceLatency.average" -queryinstances
to list the available instances. And then you can do something like
Get-Stat2 -entity $esx -interval "HI1" -Stat "disk.deviceLatency.average" -instance "naa.600507680280709ed000000000000172"
I’m afraid you have to give an instance with this type of metric.
kevin
my initial run with results was to a single esx hosts. i don’t see any code in your example to handle multiple hosts, i have been working on that. so if i connect to a vcenter, i should be able to see historical data?@LucD
LucD
@Kevin, that is correct.
On the vCenter the statistical data is collected from the ESX(i) servers and aggregated into 4 historical intervals.
In PowerCLI & vSphere statistics – Part 1 – The basics this is explained in further detail.
kevin
looks like i can only get data for the last hour no matter what interval i use. is there anyway to get historical data on disklatency?
LucD
@Kevin, are you perhaps adding the -Realtime switch. The performance data is kept on the ESX(i) for about 1 hour before it is collected by the vCenter.
Or are you connected to an ESX(i) server instead of the vCenter ?
Kurt
Hi LucD,
I am a beginner on Vsphere PowerCLi and I am trying to get the Disk IOPs and latency details of certain VMs.
I looked through your scripts. But something is not working for me.
[vSphere PowerCLI] D:\Program Files\VMware\Infrastructure\vSphere PowerCLI> $stats += Get-Stat -Entity “VMTEST” -Stat virtualDisk.totalWriteLatency.average
Start $today1am.AddDays($intStartDay) -Finish $today4am.AddDays($intEndDay)
[vSphere PowerCLI] D:\Program Files\VMware\Infrastructure\vSphere PowerCLI> $stats
$stats has not got anything.
AM I missing something?
I have created all these variables I am supplying to the command.
Regards,
Kurt
LucD
@Kurt.
You can start by checking if the Statistics level for the period you selected is set to at least 2.
Do you see the statistics in the vSphere client for that guest during that period ?
Perhaps try with a simpler construction like
Get-Stat -Entity “VMTEST” -Stat virtualDisk.totalWriteLatency.average
And then start adding the Start and Finish parameter.
Eric
@LucD
This is a pretty old post, but have you had a chance to test this against an ESXi 4.1 host? It looks like the metric counters in 4.1 were either removed or renamed. I’m not able to pull any of the metrics specified. This may be a more appropriate post for the PowerCLI community, but thought I’d ask anyway.
LucD
@Eric, I just checked and all these metrics are still there. Have a look at the Disk I/O Counters page in the vSphere Reference.
There must be something else that goes wrong.
You can send me your version of the script and other details to lucd(at)lucd(dot)info
Kris
Hi LucD,
I’m in a situation that i have to fetch the ESXTOP report for 10 ESX hosts in my environment on every day morning @ 10:00 AM. As of now doing manually but everyday it’s going weird. can you able to help me with providing some script that helps me out from this situation?
Regards,
Kris
LucD
@Kris, you can get most of the metrics that are available in esxtop with the Get-Stat cmdlet.
Be warned that while esxtop collects the metrics in 5-second intervals, with the Get-Stat cmdlet the Realtime interval works in 20-second intervals !
In my PowerCLI & vSphere statistics – Part 3 – Instances post I showed how you can get some of the metrics for the values visible in esxtop.
I would advise you to first define which metrics you want in your daily report.
An alternative you could consider is to use resxtop.
Alan Renouf
@LucD
Well, 9 into 0 really as he didnt have to sit there watching the script 😉 Thanks though, your recent posts on statistics are some of the best posts I have read, great detail in a really easy and understandable format.
Truely Amazing !
Alan Renouf
All I can say is WOW !
LucD
Thanks Alan.
You last post, PowerCLI: Automating traffic shaping on portgroups, is quite amazing as well.
A manager’s dream, 9 into 2.
Deserves a huge billboard at the next VMworld 😉