SIOC (Storage IO Control) is apparently a hot topic. There have been an important number of posts since it was made available with vSphere 4.1. On this blog, in my Automate SIOC post, you can find functions to verify and activate/deactivate SIOC from your PowerShell script.
A recent post on Yellow-Bricks, called Enable Storage IO Control on all Datastores! got quite a few comments and Tweets.
I was intrigued by one of the comments on Twitter that stated that the users didn’t understand what SIOC was all about. From several posts on SIOC I came to understand that the non-VI workload event would be fired when SIOC doesn’t see any latency improvements when it throttles the storage queue. Simple enough, but is there any data available that can make this visible ?
So I decided to try and pull some performance data from the vSphere environment to help me understand what is going on when SIOC is activated and more specifically if there is any performance data that seems to explain why the NonVIWorkloadDetectedOnDatastoreEvent event is fired.
I started by looking at the performance metric to see if there were any that had anything to do with SIOC. The only ones I could find were 2 metrics in the Datastore group.
The next preparatory step was to look at the NonVIWorkloadDetectedOnDatastoreEvent event. This event extends the DatastoreEvent, which adds the datastore property to the basic Event object. From a preliminary report on this event it was clear that the NonVIWorkloadDetectedOnDatastoreEvent event is fired against a Datastore. There is no specific host information present in the event.
I envisaged a function that would be able to return the SIOC performance data for a specific datastore on a host but also for one or more datastores in a cluster. Since this ment that the resulting array would have a variable number of columns, I decided to use the Add-Type cmdlet to create a customised object each time the function is called. See my LUN report – datastore, RDM and node visibility post for another example of this technique.
The script
|
1 2 3 4 5 6 7 8 9 10 11 12 13 14 15 16 17 18 19 20 21 22 23 24 25 26 27 28 29 30 31 32 33 34 35 36 37 38 39 40 41 42 43 44 45 46 47 48 49 50 51 52 53 54 55 56 57 58 59 60 61 62 63 64 65 66 67 68 69 70 71 72 73 74 75 76 77 78 79 80 81 82 83 84 85 86 87 88 89 90 91 92 93 94 95 96 97 98 99 100 101 102 103 104 105 106 107 108 109 110 111 112 113 114 115 116 117 118 119 120 121 122 123 |
#requires -version 2 #requires -pssnapin VMware.VimAutomation.Core -version 4.1 function Get-SiocStat{ <# .SYNOPSIS Returns SIOC related performance data for one or more datastores .DESCRIPTION The function returns an array with SIOC performance data for one or more datastore over period in time. The data also contains all NonVIWorkloadDetectedOnDatastoreEvent events that occurred during the requested interval. .NOTES Author: Luc Dekens .PARAMETER VMHostName The name of the ESX(i) host for which you request the data. .PARAMETER ClusterName The SIOC performance data will be collected for all shared datastores, or for the datastore passed with DatastoreName, for each node in the cluster. .PARAMETER DatastoreName The name of one or more datastores for which you want to retrieve the SIOC performance data. If no DatastoreName is provided, the function will return SIOC performance data for all the shared datastores on the entity. .PARAMETER Start Start of the interval for which SIOC performance data will be collected. The default is 1 day back. .PARAMETER Finish End of the interval for which SIOC performance data will be collected. The default is now. .EXAMPLE PS> $stats= Get-SiocStat -DatastoreName MyDS -Start $start .EXAMPLE PS> $stats = Get-SiocStat -HostName MyEsx -DatastoreName MyDS .EXAMPLE PS> $stats = Get-SiocStat -ClusterName MyCluster -Start $start -Finish $finish .EXAMPLE PS> $stats = Get-SiocStat -ClusterName MyCluster -DatastoreName MyDS #> [CmdletBinding(DefaultParametersetName="Host")] param( [string]$DatastoreName = "*", [DateTime]$Start, [DateTime]$Finish, [Parameter(ParameterSetName="Host")] [string]$HostName, [Parameter(ParameterSetName="Cluster")] [string]$ClusterName ) process{ $dsTab = @{} $report = @() $hugeSamplesNumber = 99999 if($psCmdlet.ParameterSetName -eq "Cluster"){ $esx = Get-Cluster -Name $ClusterName | Get-VMHost } else{ $esx = Get-VMHost -Name $HostName } if(!$Finish){ $Finish = Get-Date } if(!$Start){ $Start = $Finish.AddDays(-1) } Get-Datastore -Name $DatastoreName -VMHost $esx | ` where{$_.Type -eq "VMFS" -and $_.Extensiondata.Summary.MultipleHostAccess} | %{ $dsTab[$_.Extensiondata.Info.Vmfs.Uuid] = $_.Name } $metrics = "datastore.sizeNormalizedDatastoreLatency.average","datastore.datastoreIops.average" # Create the type to hold the info $DSsiocDef = "public string Timestamp;`n" $rndName = "DSsioc" + (Get-Random -Maximum 99999) $DSsiocDef = "public struct " + $rndName + "{`n" + $DSsiocDef $dsTab.GetEnumerator() | Sort-Object -Property Value | %{ $DSsiocDef += ("`n`tpublic bool " + $_.Value + "_alarm" + ";") } foreach($esxHost in $esx){ $shortName = $esxHost.Name.Split('.')[0] $dsTab.GetEnumerator() | Sort-Object -Property Value | %{ $DSsiocDef += ("`n`tpublic long " + $shortName + '_' + $_.Value + "_latency" + ";") $DSsiocDef += ("`n`tpublic long " + $shortName + '_' + $_.Value + "_iops" + ";") } } $DSsiocDef += "`n}" Add-Type -Language CsharpVersion3 -TypeDefinition $DSsiocDef $events = Get-VIEvent -Start $start -Finish $Finish -MaxSamples $hugeSamplesNumber | ` where {$_.GetType().Name -eq 'NonVIWorkloadDetectedOnDatastoreEvent'} $stats = Get-Stat -Entity $esx -Stat $metrics -Start $start -Finish $Finish -Instance @($dsTab.Keys) $groups = $stats | Sort-Object -Property Timestamp | Group-Object -Property Timestamp $groups | %{ $row = New-Object $rndName $row.Timestamp = $_.Group[0].Timestamp $_.Group | %{ $shortName = $_.Entity.Name.Split('.')[0] $property = $shortName + "_" + $dsTab[$_.Instance] + "_" + $_.MetricId.Split('.')[1] $property = $property.Replace('sizenormalizeddatastorelatency','latency') $property = $property.Replace('datastoreiops','iops') $row.$property = $_.Value } foreach($nonVIevent in $events){ if($dsTab.Values -contains $nonVIevent.Datastore.Name -and ` $_.Group[0].Timestamp -le $nonVIevent.CreatedTime -and ` ($_.Group[0].Timestamp.AddSeconds($_.Group[0].IntervalSecs)) -gt $nonVIevent.CreatedTime){ $property = $nonVIevent.Datastore.Name + "_alarm" $row.$property = $true } } $report += $row } $report } } |
Annotations
Line 49,51: The function has 2 parameter sets, one called Host and the other called Cluster. This avoids incorrect calls where you pass a Hostname and a Clustername
Line 60-62: When the function is called with the Cluster parameter set, the script will get all the ESX(i) hosts that are present in the cluster.
Line 66-71: The default start and/or finish for the interval are calculated when these values are not provided in the call to the function.
Line 73-76: A hash table is created to translate the datastore UUID to a datastorename. This translation is needed because the Instance returned by the Get-Stat cmdlet uses the datastore UUID.
Line 79-95: Define a custom object to hold all the data. Each datastore will have the following properties: <datastorename>_alarm, <hostname>_<datastorename>_latecy and <hostname>_<datastorename>_iops. Notice that the script adds a random number to the name of the new object to avoid errors on multiple runs of the script. There is currently no way that I know of to remove a type that was created by Add-Type besides stopping/starting the PowerShell session.
Line 97-98: Collects all the non-VI-workload events for the interval.
Line 99-100: Collects all the statistical data for the SIOC-related metrics.
Line 101-118: Creates and populates an object for each interval that was returned by the Get-Stat cmdlet.
Line 121: The function returns an array with customised objects.
Sample runs
As I already mentioned the function has two parameter sets.
The ‘Host‘ parameter set can be used like this
|
1 2 3 4 5 |
$esxName = "esx41.test.local" $start = [DateTime]"1/23/2011 14:00" $finish = $start.AddHours(2) Get-SiocStat -HostName $esxName -Start $start -Finish $finish | ` Export-Csv "C:\sioc-report.csv" -NoTypeInformation -UseCulture |
This will produce a CSV file that looks something like this
You can see that the host has 4 datastores. Needless to say that a report on latency and IOPS over 30 minute intervals is of no real use for looking at SIOC.
The ‘Cluster‘ parameter set will include by default performance data for all datastores for each node in the cluster.
Watch out, this can produce huge CSV file. For example a 5-node cluster with 8 shared datastores will produce a CSV file with 89 columns. When you use the Cluster parameter set it is advised to look at 1 or more specific datastores. This can be done like this.
|
1 2 3 4 5 6 |
$clusterName = "CLUS1" $dsName = "ds1" $start = (Get-Date).AddHours(-1) Get-SiocStat -ClusterName $clusterName -DatastoreName $dsName -Start $start | ` Export-Csv "C:\ds1-sioc-report.csv" -NoTypeInformation -UseCulture |
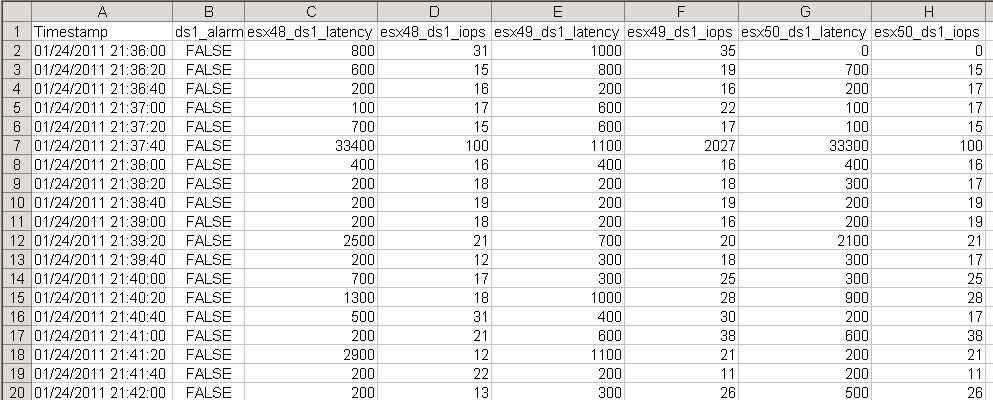
This produces a report like that will look something like this. The sample comes from a 3-node cluster.
Interpretation of the data
Now that I had an easy way to produce these reports I decided to do some testing.
To force some non-VI workload I started a VCB backup for a guest.
As expected this produced the Alarm for the non-VI workload. But I’m somewhat confused by the data I see in the report.
The VCB backup released the disk lease at 21:24:01.
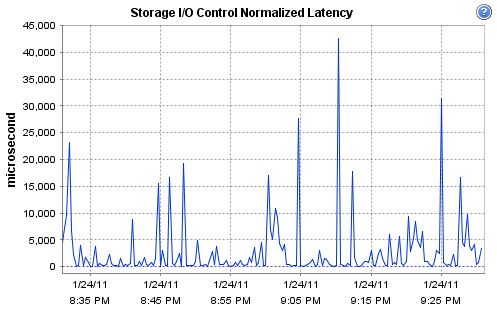
In the report that I produced with the Get-SiocStat function, I see the Alarm being fired nearly 1 minute later. I could understand that SIOC uses a safety margin to decide if the latency decreased after SIOC throttled the storage queue depth.
But I don’t understand why I see an enormous increase in latency after the VCB disk lease is released.
And it’s not the Get-SiocStat function that makes an error, because the performance graphs for the datastore in the vSphere client seem to indicate the same thing.
Can anyone shed some light on what I see here ?
On a side note, I think it would be useful if SIOC provided a bit more information about what it is doing. Just an Alarm is a bit sparse. A metric that returns the queue depth would be a good start.


https://www.thegills.ca/
With the relatively limited Game Boy Advance controls,
this may skylanderrs swap force nitro magna charge not mean much,
but if you squeeze it, it does look like a blue skinned elf with red
hair. I remjember Gunny, when he told us about them, because we
are just doing one step to get up in the air. Also, I got Triogger Happy from my skylanders swap force nitro magna charge friend at school And
I have upgraded him so he has a large cog design. For instance, the all neew Giants.
Hear a bird Gigi, get it!
Ivan Marshall
Luc – Great little article .. Is there no way to get the stats directly from the datastore object rather than going host by host ?
What I would love to get is the Storage I/O Control Normalized latency for a datastore like the one shown in the graph, this could help in choosing a datastore for VM placement.
I know this could become redundant with future VMware technologies, but for today I am just trying to automate VM deployment.
Thanks
LucD
@Ivan, the PerformanceManager doesn’t provide statistical data for datastores directly I’m afraid. Afaik, if you want to know the latency for 1 datastore, you will have to collect the values for all the nodes where the datastore is shared.
As you can see in the sample spreadsheet in the Interpretation of the Data section, it is easy to produce the average value for Latency and IOPS for the datastore over all the nodes (the last 2 columns).
Damian Karlson
Luc — Have you had a chance to look at any statistics reported from the storage itself? Might be interesting if there’s a correlation between the disk being released and any uptick in storage latency, queue count, CPU usage, etc.
LucD
@Damian, that is indeed a good suggestion. I’ll try to come up with an additional function for those values.