Another popular subject in the VMTN PowerCLI community are statistics. Quite often it’s not entirely clear to the user what is available, how the data can be extracted and how PowerShell/PowerCLI can be used to convert the raw metrics into usable reports.
Before you can fully use all that is available, there are a few key concepts that you should understand.
In this series I will try to explain some common questions.
Introduction
Since I want to focus on the practicalities of statistics, I’m not going to repeat what is already available in several excellent papers. The following are some of the papers that you should read or locations you should visit regularly, if you want to fully understand the gathering and usage of vSphere statistical data.
- Understanding VirtualCenter Performance Statistics should be read by anyone working with vCenter performance data. Gives a clear explanation of intervals, statistics levels and the update interval.
- vCenter Performance Counters an overview of the available vCenter performance counters with for each of them a short description of their purpose
- Understanding performance a great collection of documents that explain several key concepts in virtual performance.
- Performance & VMmark VMTN community is where you will find interesting discussions on performance and also a lot of documents on performance. And where you can of course post your questions !
- VROOM! “THE BLOG” on performance. The posts are written by members of VMware’s Performance Engineering Team.. Contains deep-dives, best practices, comparisons… Subscribe and read !
- Technical papers VMware publishes numerous technical papers on performance. A bit of overlap with the previous sources I mentioned but check out the list of published papers regularly.
- The vSphere Web Services SDK Programming Guide which contains in chapter 12 “Monitoring Performance” an excellent and detailed overview of the key concepts.
- The excellent Performance Troubleshooting for VMware vSphere 4 and ESX 4.0 document. It offers a very useful wizard to analyse performance problems.
Intervals
Although I promised not to repeat anything from the sources I mentioned above, this is one key concept about performance data in a vCenter environment that should be clearly understood before you start coding.
In short:
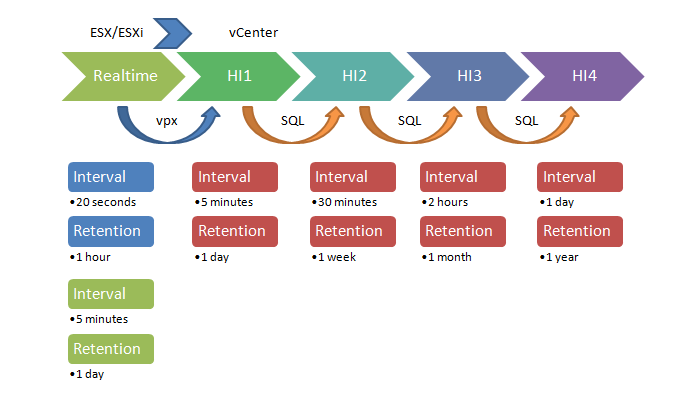
- on an ESX/ESXi server the performance data is collected for 20 seconds intervals. This is the so-called Realtime interval. This data is kept on the ESX/ESXi server for about one hour.
- The ESX/ESXi server will aggregate the realtime data into 5 minute interval data.
- The unmanaged ESX/ESXi server will keep this data for 1 day.
- The managed ESX/ESXi server will send the data to the vCenter, which stores it in the vCenter database.
- In the vCenter this 5-minute interval is consolidated into 30-minute interval data. This data is kept for 1 week.
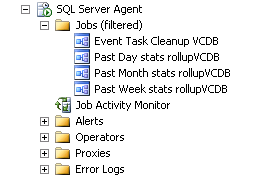
- The aggregation/consolidation of the data is done on the database where you host you vCenter db. The following are some examples from a SQL 2005 Server.
- The actual “rollup” jobs. Ignore the “event cleanup” job.
- The schedule of the daily “rollup” job.

- There are two more intervals, the 2-hour interval, which is kept for 1 month, and the 1-day interval, which is kept for 1 year.
- These 4 intervals are sometimes referred to as Historical Interval 1 (5 minutes), Historical Interval 2 (30 minutes), Historical Interval 3 (2 hours) and Historical Interval 4 (1 day).
A schematic will perhaps make this a bit clearer.
Statistics level
The statistical levels are another key concept you need to understand before you dive into statistical data gathering. In short: the statistical levels define which metrics are available in which interval.
The available statistical levels are defined as follows:
| Level | Description |
| 1 | Basic metrics. Device metrics excluded. Only average rollups. |
| 2 | All metrics except those for devices. Maximum and minimum rollups excluded. |
| 3 | All metrics, maximim and minimum rollups excluded |
| 4 | All metrics |
You define the statistical level for each “historical” interval in the vSphere Client under <Administration><vCenter Server Settings><Statistics>.
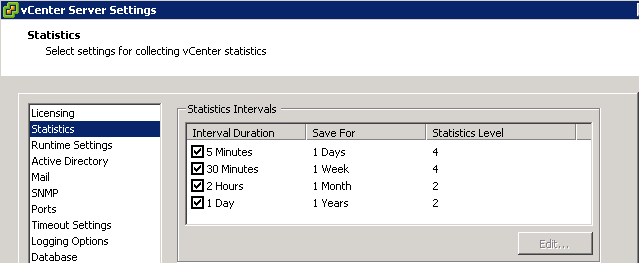
You could decide to keep all the metrics in all intervals, but you will most probably not need that level of detail for the “older” intervals. And don’t forget that the more data you keep, the bigger your VC database will become (longer roll up jobs, longer backups…).
As an example let’s take the metrics around cpu.usage. This metric comes in 3 types of roll up: minimum, average and maximum. While it definitely is useful to have all these roll up types for the realtime interval and most possibly the historical interval 1, there is really not justification to keep all these for historical interval 4.
In this case you can then safely define the statistical level for historical interval 4 to be level 2.
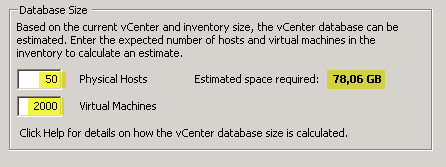
Note that the vSphere client gives you an estimate of the required space on your VC database for the statistics levels and retention periods you define. Just fill in the number of hosts and guests and you will have a rough idea !
Instances
The last key concept you need to know (I promise ;-)) before we start scripting.
The official definition from the VMware vSphere API Reference Documentation: “An identifier that is derived from configuration names for the device associated with the metric. It identifies the instance of the metric with its source.“.
Let’s try to make this a bit more understandable through an example.
Take the CPU-related metrics for an ESX/ESXi host. If the ESX/ESXi server is equipped with a quadcore CPU, there will be four instances: 0, 1, 2 and 3. In this case the instance corresponds with the numeric position within the CPU core
And there will be a so-called aggregate, which is the metric averaged over all the instances.
These instances each get their own identifier which will be part of the returned statistical data. The aggregate instance is always represented by a blank identifier.
Scripting
What is available ?
To see all the available metrics you can consult Appendix C: Performance Metrics in the Basic System Administration manual. But that appendix might not always reflect the actual situation. Due to for example upgrades or patches that introduce or change one or more metrics.
A better method is to just ask the system. With the introduction of PowerCLI 4 a new cmdlet, Get-StatType, was introduced that does just that.
The cmdlet has one required parameter, called -Entity, that allows us to indicate for which object we want to query the available metrics.
|
1 |
Get-StatType -Entity (Get-VMHost $esxName) |
In this form you will get all the metrics for an ESX/ESXi server and for all intervals. This last fact is not really useful if we have different statistical levels defined for the different intervals.
Luckily we have the -Interval parameter. It allows you to specify the interval for which you want to see the available metrics. But does this mean that you will have to learn all the statistical intervals, duration or name, by hearth ? No, you can use the Get-StatInterval to get a list of all the historical intervals.
|
1 |
Get-StatInterval |
It returns something like this

With this knowledge we can now launch the Get-StatType cmdlet with a more specific request
|
1 |
Get-StatType -Entity (Get-VMHost $esxName) -Interval "Past Day" |
And this returns a list of metrics like this.
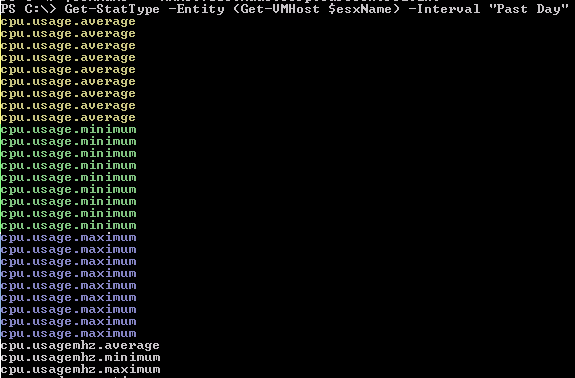
But it still looks confusing! Why do we have apparently nine times the same metric in the list ?
To take away the solution, it’s due to the instances that are available for this metric.
In this case the ESX/ESXi host contained a quadcore and hyper-threading was active, this means that there are 8 logical CPU cores as far as vSphere is concerned. And the ninth entry comes from the aggregate value, the average over all logical CPU cores.
Unfortunately the Get-StatType cmdlet doesn’t give you the available instances. To see those you will have to look at the actual statistical data. Something like this
|
1 |
Get-Stat -Entity (Get-VMHost $esxName) -Stat cpu.usage.average -MaxSamples 1 -IntervalMins 5 |
And this returns something like this

In the Instance column you will now see all the available instances for this metric. In the first line the instance is blank, this represents the aggregate instance.
Three points to note in the cmdlet and its parameters:
- Although I asked for 1 sample (-MaxSamples 1) the cmdlet returned 9 values. The -MaxSamples parameter apparently only looks at the Timestamp. It doesn’t count the number of returned values
- I used the -IntervalMins parameter to specify Historical Interval 1. If I had left out this parameter, the Get-Stat cmdlet would have used it’s default, which in this case would have returned values from Historical Interval 4. More on the Get-Stat defaults in a future post in this series.
- The parameters in the Get-Stat and the Get-StatType cmdlets are not consistent. On the Get-StatType cmdlet you have to use the -Interval parameter and on the Get-Stat cmdlet you have to use the -IntervalMins or -IntervalSecs parameters to basically achieve the same thing.
Now that we now the instances for this metric (cpu.usage.average) we can limit the values to what we actually want to see.
In this case I’m interested in the aggregate value. Now unfortunately the Get-Stat cmdlet does not have an -Instance parameter (yet). That means we will have to filter the returned data.
You could do that like this
|
1 |
Get-Stat -Entity (Get-VMHost $esxName) -Stat cpu.usage.average -IntervalMins 5 | where{$_.instance -eq ""} |
This returns something like this

Intervals and values
In the Intervals section I tried to explain what the statistics intervals are all about.
Now when you use the Get-Stat cmdlet it is quite important to know in which interval(s) your query will get its values and what the impact will be on the returned values.
First lets have a look at how you specify a time range to which you want to limit your query. To define a time range you use the -Start and -Finish parameters. With the help of the Get-Date cmdlet and some of its methods you can easily define time ranges. Something like this.
|
1 |
Get-Stat -Entity (Get-VMHost $esxName) -Stat cpu.usage.average -Start (Get-Date).AddDays(-4) -Finish Get-Date).AddDays(-3) | where{$_.Instance -eq ""} |
And this returns
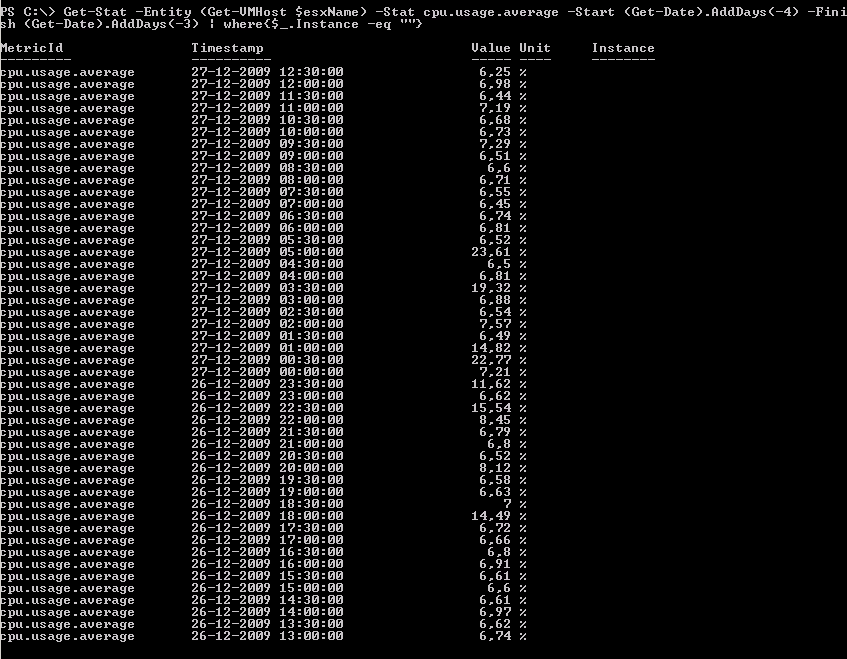
But for reporting you normally don’t want your intervals to start at the same time, albeit on another day, that you execute the Get-Stat cmdlet. In your reports the intervals should start at midnight and stop with the last interval before midnight.
Thanks to the PowerShell magic this is not too hard to accomplish. This is just one way of doing this, there are most probably other methods.
|
1 2 |
$todayMidnight = Get-Date -Hour 0 -Minute 0 -Second 0 Get-Stat -Entity (Get-VMHost $esxName) -Stat cpu.usage.average -Start $todayMidnight.AddDays(-4) -Finish $todayMidnight.AddDays(-3) | where{$_.Instance -eq ""} |
And now we get these values.
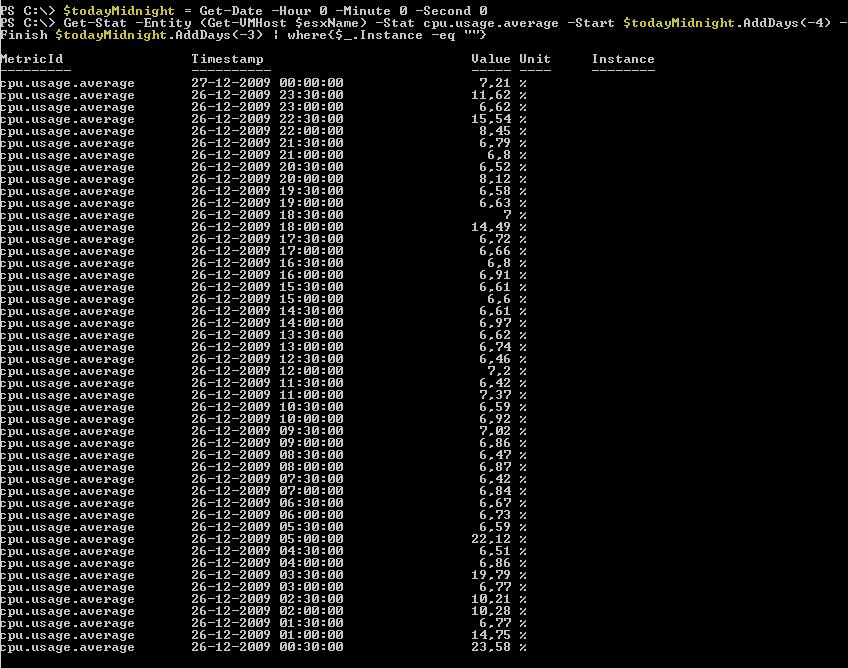
Nearly there, but the start and end interval are one off. Again easy to correct by subtracting a number of minutes (less than the interval of course) from the -Start and -Finish parameters.
|
1 2 |
$todayMidnight = (Get-Date -Hour 0 -Minute 0 -Second 0).AddMinutes(-1) Get-Stat -Entity (Get-VMHost $esxName) -Stat cpu.usage.average -Start $todayMidnight.AddDays(-4) -Finish $todayMidnight.AddDays(-3) | where{$_.Instance -eq ""} |
And now the interval starts at midnight and ends with the last interval of that day.
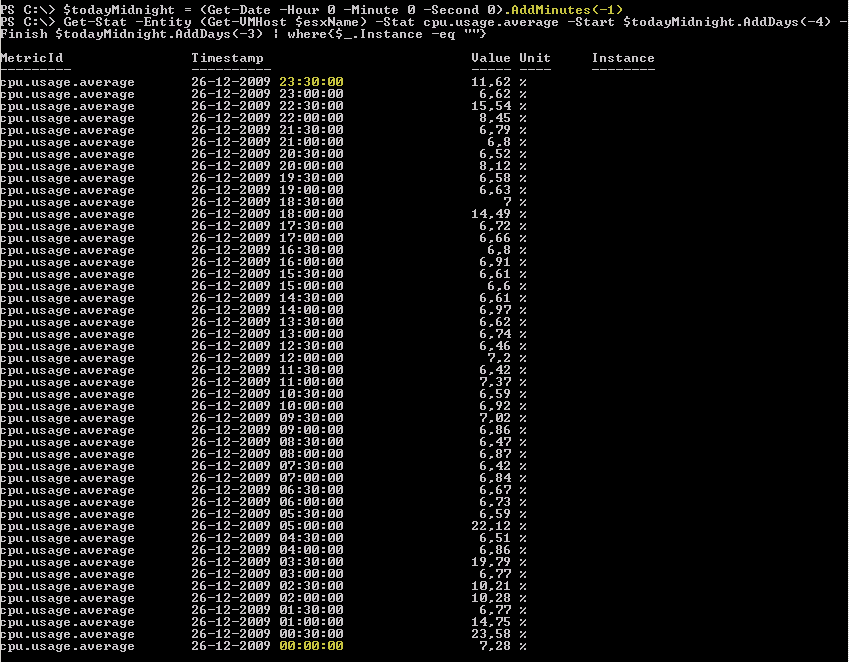
This concludes the first part in the “statistics” series. This post just touched the basics (hence the title) of statistics gathering with PowerCLI.
Watch out for future posts where I will go into more specifics.
In the mean time, if you have any questions or are trying to find out how something could be done with the Get-Stat cmdlet, feel free to post your question(s) or problem(s) in the comments.
Happy New Year and see you in 2010.

Jyoti Maindola
Hello LucD
I’m trying to export the realtime CPU and Memory usage of all the Virtual Machines in vCenter but my script is giving me the exact values.
Below is my script. Please Assist me. Thank you in advance!
$report = @()
$metrics = “cpu.usagemhz.average”,”mem.active.average”
$vms = Get-Vm | where {$_.PowerState -eq “PoweredOn”}
Get-Stat -Realtime -MaxSamples 1 -Entity ($vms) -stat $metrics | where{$_.instance -eq “”} | `
Group-Object -Property EntityId | %{
$row = “”| Select VmName, Timestamp, vCPU,CpuUsed,MemAlloc,MemUsed
$row.VmName = $_.Group[0].Entity.Name
$row.Timestamp = ($_.Group | Sort-Object -Property Timestamp)[0].Timestamp
$row.vCPU = $_.Group[0].Entity.NumCpu
$cpuStat = $_.Group | where {$_.MetricId -eq “cpu.usagemhz.average”} | Measure-Object -Property Value -Maximum
$row.CpuUsed = “{0:f2}” -f ($cpuStat.Maximum)
$row.MemAlloc = $_.Group[0].Entity.MemoryMB
$memStat = $_.Group | where {$_.MetricId -eq “mem.active.average”} | Measure-Object -Property Value -Average
$row.MemUsed = “{0:f2}” -f ($memStat.Average)
$report += $row
}
$report | Export-Csv “C:\JYOTI\Temp\VMUsage.csv” -NoTypeInformation -UseCulture
LucD
You probably want the cpu.usage.average and the mem.usage.average metrics.
They are both expressed in percentages
Jyoti Maindola
Thanks for the reply.
No my result is not coming in percentages. I’m not getting the exact realtime values.
LucD
Did you replace the names of the metric everywhere in the snippet?
Can you show me what you mean by “I’m not getting the exact realtime values“?
Jyoti Maindola
After executing the script, I’m getting the following result (showing only for single VM):
VmName Timestamp vCPU CpuUsed MemAlloc MemUsed
####VMName 6/1/2022 14:22 4 45 4096 209712
But vCenter is showing the following stats for the same VM at the same time:
“Capacity and Usage
Last updated at 2:22 PM
CPU
43 MHz used
4 CPUs
allocated
Memory
204 MB used
4 GB
allocated”
I want the VALUES to be same.
Thank you!
LucD
In vCenter you see an average over a specific time interval.
With Get-Stat and the Realtime switch, you get the average for the last 20 seconds interval.
These values will never be exactly the same.
Jyoti Maindola
Thank you so much for your help!
Hammad
I have seen the posts and those are very helpful. I want to extract onw week esxi host cpu and memory utilization. Plz help to create a script for this.
LucD
Please have a look at the examples in this Statistics series, there are examples of what you are asking for.
If you get stuck, feel free to ask.
Raju
Is there a way to pull the statistics data(cpu, memory and disk) from the powered off vm’s?
LucD
Hi Raju,
The statistical data is stored in the vCenter DB.
So yes, you can retrieve the data while the VM is powered off.
But there will only be data for the period the VM was powered on.
Ismael
Hi LucD
Thanks for your pretty detailed info and examples.
I’m pretty new to scripting and although I have tried im not getting the exact same info that I can collect in vCenter.
How can I take the average cpu% in lets say last 24H or in an specific 24H interval, I don’t want all the measures just a single one with the average of all.
Could you please point me out the get-stat command to do that?
Thanks.
LucD
Hi Ismael,
The Measure-Object cmdlet is great to calculate averages.
You could do something like this for example.
$stat = 'cpu.usage.average'
$start = Get-Date -Date "28 March 2017"
$finish = $start.AddDays(1)
$entity = Get-VMHost -Name esx1.local.lab
Get-Stat -Entity $esx -Stat $stat -Start $start -Finish $finish |
Measure-Object -Property Value -Average | Select -ExpandProperty Average
Hope that helps.
Jamey
Love all the great information you share!! Thank you for helping empower the many VMware administrators go beyond the basics!
Paddu
Good read.. Thanks for the basics!!
Sid
I am trying to get cpu affinity stats from ESXi host using PowerCLI.
For example by executing “sched-stats -t cpu | grep vcpu” command against ESXi I am able to get affinity.
However, If I am using Get-stat cmdlet I am not able to retrieve affinity for the same host as shown in the above output. So please let me know if it is possible to retrieve same result using Get-Stat cmdlet.
In case if it is not possible using Get-Stat can I execute same command “sched-stats -t cpu | grep vcpu” using PowerCLI and get the result. I have tried PowerCLI ESXCLI command but I am not able to get desired output.
Thank you for your help.
russ oconnor
Luc, I don’t think this was mentioned, but by changing the ‘Save For’ on 5 minutes we can have a reasonably granular collection going back 5 days. I’ve seen the stats get flattened by the consolidation.
https://virtualizationgains.com/virtual-machine-performance-high-cpu-ready/
thanks for all your great work
LucD
Thanks Russ, that is indeed a useful option to see more granular data for a longer period of time.
I didn’t mention the option in this post, since most documentation seems to advise against changing these default. But you’re right, it can be done, it will not break anything.
Just be aware that this might have a serious impact on the size of your vCenter database. The DB will grow (data and transaction logs). Make sure there is enough free space available for the coming 4-5 days when you do this.
reac
how can i get the past one month average utilization number and max utilization number of a ESXi host
Thanks
Reac
LucD
Hi reac,
Not sure what you mean I’m afraid.
Are you talking about CPU and Memory usage ?
Joey
Lucd
when I run this, I see no stats
Get-Stat -Entity (Get-VMHost $esxName) -Stat cpu.usage.average -Start (Get-Date).AddDays(-4) -Finish (Get-Date).AddDays(-3) | where{$_.Instance -eq “”}
I see no data
I only seem to see data when I use
-Maxsamples 1 -Intervalmins 5
could this be because my vcenter statistics level al all at 1
LucD
I would guess so.
With the Stats Toolbox you can check what is there.
sniff
Hi, please tell me if you know below question.
When I issue get-stat cmdlet for vCenter, what kind of SQL issue to vCenterDB?
I would like to get performance statics via get-stat, however some times it failed cause of returned 0 result.
LucD
All PowerCLI cmdlets are based on API calls that you find the API Reference.
If Get-Stat returns no objects for one or more entities, it could be that there is no statistical data available for these entities in the requested timeframe.
A good way to check, is to use the Performance tab in the vSphere client or web client, and check if there is data for requested time period and for the requested metrics.
sniff
Thank you LucD-san!
Daniel
Was there ever a post on Get-Stat defaults in regards to the intervals? What interval does it retrieve from if I do a Get-Stat on mem.usage.maximum without setting an interval?
LucD
Hi Daniel,
No, afaik there hasn’t been such a post.
But you gave me a good idea 🙂
Luc
Ganesh Prasad Pal
Helo LucD,
Thanks,
I am getting below error while putting the command.
==================================
PowerCLI C:\> Get-Stat -Entity (Get-VMHost $esxName) -Stat cpu.usage.average -Ma
xSamples 1 -IntervalMins 5
Get-VMHost : Cannot validate argument on parameter ‘Name’. The argument is null
or empty. Supply an argument that is not null or empty and then try the comman
d again.
At line:1 char:29
+ Get-Stat -Entity (Get-VMHost <<<
LucD
Hi Ganesh,
It looks as if there no value in the variable $esxName.
Can you try to assign the name of one of your ESXi servers to the variable ?
$esxName = "MyEsxServer"
Rich
Hi LucD,
Thank you very much for this post – helps a lot!
When I execute to find intervals, I don’t see RealTime – how do I get the available stats for RT?
PowerCLI C:\Program Files (x86)\VMware\Infrastructure\vSphere PowerCLI> Get-Stat
Interval
Name Sampling Period Secs Storage Time Secs
—- ——————– —————–
Past day 300 86400
Past week 1800 604800
Past month 7200 2592000
Past year 86400 31536000
admin
Thanks Rich.
You can use the Realtime switch on the Get-StatType cmdlet.
For example:
Get-StatType -Realtime -Entity $esx
Tuhin
Hi,
This is really useful and explanatory for people like me who are just starting off in powershell scripting ( or any kind of scripting !! ).
The command which gets the performance metric values for a time interval, gives a timewise segregation of the outputs..what I need to produce is a singe average value for a defined span of time.
For example, if I want the cpu average of a host for the last 4 hours, I am using
Get-Stat -Entity (Get-VMHost esx01) -Stat cpu.usage.average -Start (Get-Date).AddHours(-4) -Finish Get-Date).AddHours(-0)
It outputs the cpu average value of every 5 minutes for that host..what I really want is a single average value for the entire span of 4 hours.
Could you please help??
LucD
Thanks Tuhin.
When you have the values for 5-minute intervals, you can use another PowerShell cmdlet to calculate the average over all the intervals. That is done with the Measure-Object cmdlet.
Something like this for example
Get-Stat -Entity (Get-VMHost esx01) -Stat cpu.usage.average -Start (Get-Date).AddHours(-4) |

Measure-Object -Property Value -Average |

Select-Object -ExpandProperty Average
What happens, all the objects returned by the Get-Stat cmdlet are placed on the pipeline, where the Measure-Object cmdlet receives them.
The Measure-Object cmdlet will take the value found in the Value property and return the average.
To extract the single Average value from object returned by the Measure-Object cmdlet, the Select-Object cmdlet is used.
Does that make it any clearer ?
mario
Very good Article, thanks al lot!!
LucD
Thanks, you’re welcome
frank
Hi
i have a scenario where in my Vcenter Server there are 3 ESXi hosts. So when i get cpu.usage.average metrics i get three aggregate values ( 1 for each of them)…What i need is ONE aggregated value for My WHOLE Vcenter….so that i can determine if the Vcenter Health is down….its like i wana monitor VCenter Health based on CPU usage and not individual ESXi…can any one help asap
thanks
LucD
@Frank, with the help of the Measure-Object cmdlet it is quite easy to create an aggregate from the three values you have. Something like this
$aggregate = ($stats | Measure-Object -Average -Property Value).Average
Mike Leone
Very informative article, thanks. One question, tho – if I was measuring cpu.usage,average of a *VM* (not an ESX/ESXi server), would I still need to specify an instance? Presume all VMs have at least 2 vCPUs; in that case, I would want to use the instance indicator as you have (.instance -eq “”)
LucD
@Mike, thanks.
You are correct, if you are interested in the aggregate value, you would have to use the “” instance.
Note that the Get-Stat cmdlet in the latest PowerCLI builds does have an Instance parameter. So you can specify the instance immediately with the Get-Stat cmdlet.
cybercoaster
@LucD
Thanks so much, that did the trick! I have lots to learn.
Cybercoaster
I am wanting to get an output of the average cpu usage for all of our servers. I am using the following code however I would like each line to also list the host that it came from.
Right now it just outputs the date/time/% I would like to output this to a CSV so I can import in Excel and sort by hostname.
Any help would be much appreciated as I am pretty new to this and still looking through a lot of web sites and examples.
$vhosts – (get-vmhost)
foreach ($vhost in $vhosts){
Get-Stat -Entity (Get-VMHost $vhost) -Stat cpu.usage.average
}
LucD
@Cybercoaster. The server information is present in the returned objects, but you are not seeing that ‘property’ because of the Format file that comes with PowerCLI.
In such a Format file you define which properties of a specific object are displayed by default.
With the Select-Object cmdlet you can specify explicitely which properties you want to see.
In your case, you could do:
Get-Stat -Entity (Get-VMHost) -Stat cpu.usage.average |
Select @{N="Server";E={$_.Entity.Name}},

MetricId,Timestamp,Value,Unit,Instance |
Export-Csv "C:\server-cpu-avg.csv" -NoTypeInformation -UseCulture
The ‘Server’ property is a so-called calculated property. You provide a name (N) for the property and an expression (E) how to get the value of the property. The rest of the properties are the same level-1 properties you see in the default display of the object.
Also note that you can provide all servers in 1 call to Get-Stat. This will be considerably faster than making an individual call for each host.
iwan 'e1' ang
Thanks for sharing this. It has been useful in one of my client’s request.
Drinks on me when you visit Singapore.
e1@Singapore
Tchek14
Hello,
When I launch this command :
Get-StatType -Entity (Get-VMHost $esxName) -Interval “Past Day”
I don’t have stat cpu.usage.minimum and cpu.usage.maximum. How can enable this metrics ?
Thanks in advance
LucD
@Tchek14. To collect minimum and maximum metrics the statistics level has to be at level 4.
See the Statistics level section above.
lastcall
Hi, can you help me? this script runs but it doesn’t give me the data i need. i need to come up with performance stats of % cpu usage and % memory usage over the past month per host per vm per hour. then i can create a pivotchart which i can automate into a macro hopefully (as i can do it manually). this script creates an excel spreadsheet and populates the sheets with data only not the data i need. also, can the vm’s be grouped by vmhosts which are grouped by clusters? so, this way my data is hierarchical ie: by cluster, vmhost, and vm. i havent written many scripts and i have been playing with the get-stat command however i dont know how to identify the host’s/vm’s that i am extracting data from.
# Get VM / Datastore / Host information from VMware clusters and add it to a excel spreadsheet,
# please note that you will need the VMware powershell plugins and a copy of Excel on the machine running the code.
#YOURSERVER
Connect-VIServer -Server 192.168.24.6 -User lab\john.weber -Password L3tm3in!
$Excel = New-Object -Com Excel.Application
$Excel.visible = $True
$Excel = $Excel.Workbooks.Add()
$Addsheet = $Excel.sheets.Add()
$Sheet = $Excel.WorkSheets.Item(1)
$Sheet.Cells.Item(1,1) = “Name”
$Sheet.Cells.Item(1,2) = “Number of CPUs”
$Sheet.Cells.Item(1,3) = “Memory (MB)”
$WorkBook = $Sheet.UsedRange
$WorkBook.Font.Bold = $True
$intRow = 2
$colItems = Get-VM | Select-Object -property “Name”,”NumCPU”,”MemoryMB”
foreach ($objItem in $colItems)
{
$Sheet.Cells.Item($intRow,1) = $objItem.Name
# $powerstate = $objItem.PowerState
# If ($PowerState -eq 1) {$power = “Powerd On”}
# Else {$power = “Powerd Off”}
$Sheet.Cells.Item($intRow,2) = $objItem.NumCPU
$Sheet.Cells.Item($intRow,3) = $objItem.MemoryMB
$intRow = $intRow + 1
}
$WorkBook.EntireColumn.AutoFit()
$Sheet = $Excel.WorkSheets.Item(2)
$Sheet.Cells.Item(1,1) = “Name”
# $Sheet.Cells.Item(1,2) = “Free Space”
# $Sheet.Cells.Item(1,3) = “Capacity”
$WorkBook = $Sheet.UsedRange
$WorkBook.Font.Bold = $True
$intRow = 2
$colItems = Get-cluster | Select-Object -property “Name” #,”FreeSpaceMB”,”CapacityMB”
foreach ($objItem in $colItems)
{
$Sheet.Cells.Item($intRow,1) = $objItem.Name
# $Sheet.Cells.Item($intRow,2) = $objItem.FreeSpaceMB
# $Sheet.Cells.Item($intRow,3) = $objItem.CapacityMB
$intRow = $intRow + 1
}
$WorkBook.EntireColumn.AutoFit()
$Sheet = $Excel.WorkSheets.Item(3)
$Sheet.Cells.Item(1,1) = “Name”
# $Sheet.Cells.Item(1,2) = “State”
$WorkBook = $Sheet.UsedRange
$WorkBook.Font.Bold = $True
$intRow = 2
$colItems = Get-VMhost | Select-Object -property “Name” #,”state”
foreach ($objItem in $colItems)
{
$Sheet.Cells.Item($intRow,1) = $objItem.Name
# $state = $objItem.State
# If ($state -eq 0) {$status = “Connected”}
# Else {$status = “Disconnected”}
# $Sheet.Cells.Item($intRow,2) = $status
$intRow = $intRow + 1
}
$WorkBook.EntireColumn.AutoFit()
LucD
Hi John,
That sounds like a great practical application. Let me see what I can come up with. Might even do a dedicted post on this.
Ravi
Great work..