
Finding out which performance counters are available on your vSphere server over which time interval, is not always an easy task. There is of course the Performance Manager entry in the VMware vSphere API Reference, but that is not always the easiest task. Let alone finding out what a specific counter actually represents.
For that reason I decided to create a tool, which I called the Stats Toolbox, that would query the vSphere server to get the actual list of counters it collects for each interval. In the tool I added some extra features that would make working with the performance counters easier.
 During our VMworld 2014 US breakout session I demonstrated the features of the Stats Toolbox, and I received quite some positive feedback.
Stats Toolbox Overview
The Stats Toolbox is a PowerShell/PowerCLI script that uses a GUI to interact with the user. The form that is presented has several regions.
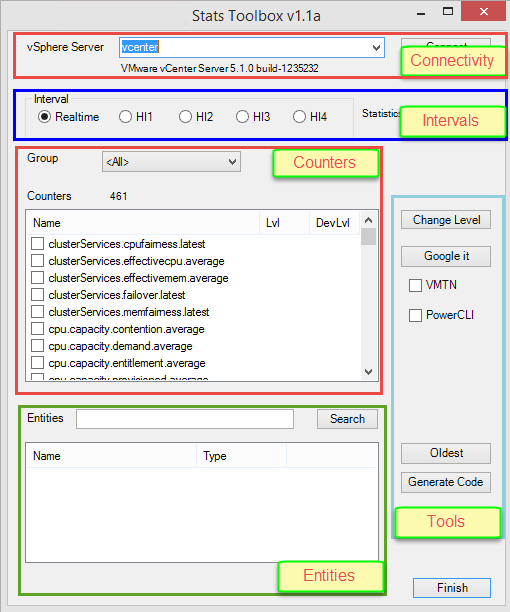
Connectivity
This is where you connect to a vSphere server. That can be a vCenter or an ESXi server. The names of the servers are saved in an INI file in the current directory.
When a connection is established, the type and version of the vSphere server will be displayed.
Intervals
There are 5 possible intervals. The Realtime interval is available on an ESXi server, it captures all the counters and it buffers approximately 1 hour of performance data. This is, by default, the only available interval on an ESXi server. When you connect to an ESXi server, the Historical Intervals are not available.
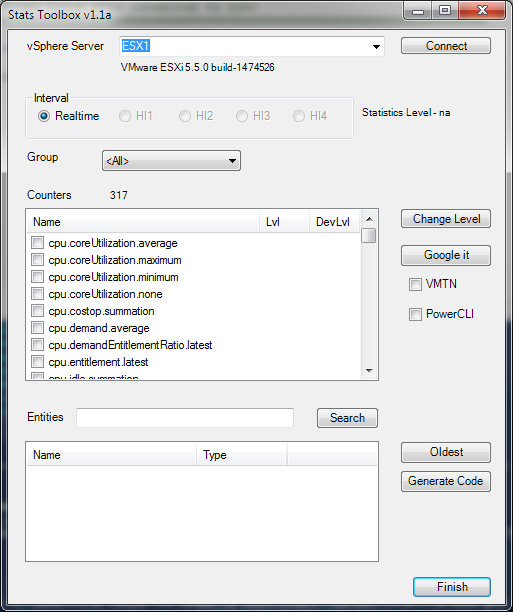
The Historical Intervals, 1 till 4, are available on a vCenter server. The counters in these intervals are created by the aggregation jobs that run on the vCenter database at regular intervals. The available counters in each of these intervals are determined by the Statistics Level that is defined for each Historical Interval.
You can find more information on these intervals in my PowerCLI & vSphere statistics – Part 1 – The basics post.
Counters
The table lists all available counters for a specific interval and for a specific counter group. The counter group “<All>” will display all counters.
Note that in the Historical Intervals there is a distinction between the regular, or aggregate, level and the device level. The regular level will return an average over all the individual devices. For example, the average over CPU0, CPU1, CPU2 and CPU3. The device level returns the counter per device. In the same example, there would be a counter for CPU0 and CPU1 and CPU2 and CPU3.
Entities
The entities list shows all inventory items on the connected vSphere Server for which performance data is available. The Search option accepts Regular Expressions. For example, the search string “^test” will return all inventory items that start with “test”.
Tools
There are a number of tools available for the counters and for the entities. A short overview.
Change Level
Allows one to change the regular or device level for a specific counter or counters. Watch out, this might increase the size of your vCenter database !
Google It
The button will open your default browser, and start a Google search with the selected counter. You can fine-tune the search, by limiting the results to the VMTN communities or to the PowerCLI community.
Oldest
This will return for the selected entity/entities the oldest available performance data.
Generate Code
The script will generate a Get-Stat script that uses the selected counter(s) and entity/entities. The generated code is available in the clipboard.
A short demo
During the VMworld 2014 US session we showed the following demo. It runs through all the available features in the Stats Toolbox.
Download script
[wpfilebase tag=file id=14]
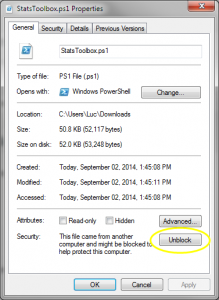
After you download the script, make sure to “Unblock” it.
This is a first public version of the Stats Toolbox. If you encounter any issues, please let me know. And feel free to suggest features to add to the Stats Toolbox.
Enjoy !
Kamam
Hello,
I just download and start the tools I receive this lines :
===
Add-PSSnapin : No snap-ins have been registered for Windows PowerShell version 4.
At C:\share\StatsToolbox.ps1:1430 char:3
+ Add-PSSnapin -Name VMware.VimAutomation.Core | Out-Null
+ ~~~~~~~~~~~~~~~~~~~~~~~~~~~~~~~~~~~~~~~~~~~~
+ CategoryInfo : InvalidArgument: (VMware.VimAutomation.Core:String) [Add-PSSnapin], PSArgumentException
+ FullyQualifiedErrorId : AddPSSnapInRead,Microsoft.PowerShell.Commands.AddPSSnapinCommand
===
To GUI is started , when I put the vcenter IP@ I have this outputs on the powershell :
===
Connect-VIServer : The term ‘Connect-VIServer’ is not recognized as the name of a cmdlet, function, script file, or operable program. Check the
spelling of the name, or if a path was included, verify that the path is correct and try again.
At C:\share\StatsToolbox.ps1:443 char:7
+ Connect-VIServer -Server $vSphereServer.Text
+ ~~~~~~~~~~~~~~~~
+ CategoryInfo : ObjectNotFound: (Connect-VIServer:String) [], CommandNotFoundException
+ FullyQualifiedErrorId : CommandNotFoundException
===
Any Advice will be very appreciated.
Many Thanks,
Kamam
Resolved by installing Power CLI
🙂
Martin
Hi,
I’ve tried different browsers/machines but the download operation of this toolbox never completes.
The part of the file I do manage to download ends with:
$LvlDevLabel.Location = $System_Drawing_Point
$LvlDevLabel.
Should there be more / is the file corrupted?
LucD
Hi Martin,
Just tried it myself (from FF and Chrome), and both seem to be working for me.
The script should end with
# Show form
GenerateForm
$script:vServers | Set-Content -Path $statToolboxIni -Force -Confirm:$false
$VerbosePreference = $oldVerbose
$WarningPreference = $oldWarning
#endregion
Luc
Martin
Thanks and apologies Luc, it must be a security precaution or something on our company network as I managed to download the file on my phone.
Walter Steins
I am getting a strange error after running a script that was generated by the toolbox. What happens is that I get an error at the end of the Script runs, and gives me the results requested, but then displays an error message that the counter I am using doesn’t exist.
Here is the script created by the tool:
#————————————
# Code generated by the Stats Toolbox
#————————————
$stat = “cpu.totalmhz.average”,”cpu.usagemhz.average”
# Update the Start and Finish values
$finish = Get-Date
$start = $finish.AddDays(-7)
$entities = Get-Inventory -Name “Ops-Test”,”Enclave4″,”DMZ”,”Linux”,”Oracle”,”Enclave2″,”Scan”
# Get-Stat -Entity $entities -Stat $stat -Start $start -Finish $finish
Get-Stat -Entity “DMZ” -Stat $stat -Start $start -Finish $finish
Additionally, when I try to run it using the $entities for the Entity, I get an error that states that the only entities that can be queried are clusters, hosts, datastores, etc. Those listed in the line are clusters.
Any thoughts?
LucD
Hi Walter,
This could be caused by the Statistics Levels you have defined.
In the Stats Toolbox when you select H2 (Historical Interval 2), which levels do these 2 counters show ?
Are you capturing that level in the vCenter Statistics Levels ?
An other possibility could be that one of the VMs wasn’t running 1 week ago. Unfortunately Get-Stat looks only at the Start time to determine if there are values available for the counter.
You can check this by selecting the VM and then clicking the “Oldest” button.
Let me know if this helps.
Luc
afham
THis would work on vcenter 6?
LucD
It should.
Do you get errors ?
russ oconnor
brilliant, very helpful as our stats collections very per vcenter
love the generate code button
mike t
Great tool, thanks for all the effort you put in to this. And many more thanks for everything you do for the community.
SebastianT
Hi LucD,
Is there a way to get it running for Vsphere 4.1 as well, up to now I found no way to edit single counter Levels in 4.1. but I need it to get our old 4.1 Vcenter into a Performance monitoring tool (lpar2rrd – https://www.lpar2rrd.com/ – I do Beta testing). It worked like a charm for our 5.5 VC.
BR Sebastian
LucD
Hi Sebastian,
The functionality to change the statistics level for a counter is based on the UpdateCounterLevelMapping method. And that method, unfortunately, only was introduced in vSphere 5.
SebastianT
Hi LucD,
That at least explains why there is no howto about it ;-).
Thank you a lot for the answer and for sharing all your knowledge about VSphere performance counters. No one else has yet delivered such a comprehensive work for this topic. Thank you!
LucD
Wow, thank you. Much appreciated
SebastianT
Hi LucD,
I currently try to change a power counter, but when I mark for example power.power.average and click Change Level, nothing happens, no popup comming. THis tool worked for me in the past nicely when changing cpu and mem counters but will not do it on power. Does this mean that data collection for them is generally disabled? How can I check this (ideal would be in Powershell)?
Sebastian
Hi,
Awesome work, works like a charm for our 5.5 Vcenter, but I can’t use it to change 4.1 Vcenter Collection Levels. I need to change speciffic counters from Level 2 to 1. I was not able to find a guide how to change this counters without your tool on 4.1
Here the Error I get
Error on updating “UpdateCounterLevelMapping” with1 argument(s): “The method is not supported in the API version 4.1.”
In Zeile:561 Zeichen:9
+ $script:perfMgr.UpdateCounterLevelMapping($map)
+ ~~~~~~~~~~~~~~~~~~~~~~~~~~~~~~~~~~~~~~~~~~~~~~~
+ CategoryInfo : NotSpecified: (:) [], MethodInvocationException
+ FullyQualifiedErrorId : NotSupportedException
ScottG
OK, got it to work. It does not like being run from powershell plus. awesomeR, now that the code generates.
LucD
Great !
I only tested the script from the PowerShell command window and the PowerShell ISE.
ScottG
Awesome toolbox. love that I can change the levels right from the tool. I seem to not be able to generate code and have it copie to my clipboard. any thoughts?
LucD
Thanks.
Ouch, that should not happen.
Can you tell me a bit more of the environment you are using: Windows version, PowerShell version…