
The end of the year is near again. Time to plan for the new, but also a time to look back on what was there in the past year.
Your vSphere environment is no different. It is time to produce some of those dreaded year reports that will show you how your environment has been doing. And one of the aspects a lot of people are very keen about, is the number 9 game 😉

What was the uptime of the VMs you had running ?
The question popped up on several occasions in the PowerCLI Community as well. So I guess I was not the only one that was looking for a way to calculate the uptime of Virtual Machines.
Bug alert ?: it seems that the PerformanceManager handles vMotions in a strange way. After a vMotion the sys.uptime.latest is reset to 0 (zero). That is understandable, since the VM is now running on a different ESXi host. But it seems that the aggregated metric do not add up all the sys.uptime.latest metrics from different ESXi hosts. So when you use DRS or do vMotions yourself, the produced report will have some serious flaws !
The Solution
As it turns out there are 2 performance metrics available in vSphere that allow you to retrieve Uptime measurements for VMs. These are the sys.uptime.latest and sys.osUptime.latest counters, both belong to the System Counters.
Although the sys.osUptime.latest counter would be better suited for our purpose, but the problem is that it requires Statistics Level 4. And very few installation have their Historical Interval 4 (the last year) configured for Statistics Level 4. The sys.uptime.latest counter only requires Statistics Level 1, so it’s this one we will use in the script.
See my PowerCLI & vSphere statistics – Part 1 – The basics post for more information on intervals and levels.
The latest qualifier at the end of the countername indicates the rollup type that is used. Latest is one of the available rollup types and it means “The most recent value of the performance counter over the summarization period“. In short, when a VM is powered on, the value of the counter will be zero. At the end of each interval, and provided the VM has not been powered off/powered on during the interval, the value of the counter will be incremented by the number of seconds in the measurement interval.
See my PowerCLI & vSphere statistics – Part 5 – Rollup Types post for more information on rollup types.
As an example, when a VM has been powered on in the middle of a 20-seconds interval, the value of the counter will be 10 (seconds) at the end of that interval. Each 20-seconds interval, the value of the counter is incremented by 20 seconds.
The Script
|
1 2 3 4 5 6 7 8 9 10 11 12 13 14 15 16 17 18 19 20 21 22 23 24 25 26 27 28 29 30 31 32 33 34 35 36 37 38 39 40 41 42 43 44 45 46 47 48 49 50 51 52 53 54 55 56 57 58 59 60 61 62 63 64 65 66 67 68 69 70 71 72 73 74 75 76 77 78 79 80 81 82 83 84 85 86 87 88 |
function Get-VMUptime { <# .SYNOPSIS Calculate the VM uptime percentage .DESCRIPTION The function will calculate the uptime percentage for a VM for a given period of time .NOTES Author: Luc Dekens .PARAMETER VM One or more virtual machines. This parameter accepts pipeline input. .PARAMETER Start Start of the interval over which the uptime percentage shall be calculated. THe default is 7 days ago. .PARAMETER Finish End of the interval. The default is 'now'. .EXAMPLE PS> Get-VMUptime -VM MyVM .EXAMPLE PS> Get-VM VM | Get-VMUptime -Start $start #> param( [CmdletBinding()] [Parameter( Position=0, Mandatory=$true, ValueFromPipeline=$true, ValueFromPipelineByPropertyName=$true )] [PSObject[]]$VM, [Datetime]$Start = ((Get-Date).AddDays(-7)), [Datetime]$Finish = (Get-Date) ) process { $extraStart = $Start.AddDays(-1) Get-Stat -Entity $VM -Stat "sys.uptime.latest" -Start $extraStart -Finish $Finish -ErrorAction SilentlyContinue | Group-Object -Property {$_.Entity.Name} | %{ if($_.Group){ $totalUptime = 0 $intervalDuration = $_.Group[0].IntervalSecs $numberOfSamples = $_.Count - (86400 / $intervalDuration) $startInterval = $_.Group[$numberOfSamples - 1].Timestamp - (New-TimeSpan -Seconds $intervalDuration) $uptime = New-TimeSpan -Seconds $_.Group[0].Value if(($_.Group[0].Timestamp - $uptime) -le $startInterval){ $totalUptime = $numberOfSamples * $intervalDuration } else{ $i = [math]::Floor($_.Group[0].Value/$intervalDuration) $totalUptime = $_.Group[0].Value $i++ while($i -lt $numberOfSamples){ if(0,1 -notcontains $_.Group[$i].Value){ $j = $i + [math]::Floor($_.Group[$i].Value/$intervalDuration) + 1 if($j -le $numberOfSamples){ $totalUptime += $_.Group[$i].Value $i = $j++ } else{ $partialIntervalValue = $_.Group[$i].Value - $_.Group[$i + 1].Value $completeIntervals = $numberOfSamples - $i - 1 $fullIntervalsValue = $completeIntervals * $intervalDuration $totalUptime += ($fullIntervalsValue + $partialIntervalValue) $i = $j } } } } New-Object PSObject -Property @{ VM = $_.Name Uptime = [math]::Round(($totalUptime / ($numberOfSamples * $intervalDuration) * 100),2) Unit = "percent" Start = $startInterval Finish = $_.Group[0].Timestamp } } else{ New-Object PSObject -Property @{ VM = $_.Name Uptime = "no data" Unit = "" Start = $Start Finish = $Finish } } } } } |
Annotations
Line 30-31: The default Start time is 7 days ago and the default Finish time is now.
Line 35: To be able to calculate the uptime of the first interval that falls inside the requested interval, the script needs at least 1 metric that is outside this requested interval.
Line 37: The Group-Object is used to separate the returned metrics by VM.
Line 41: To calculate the total number of returned metrics the script needs to substract the extra day (24*60*60) that was added in line 35.
Line 44-46: If the value is greater than the requested interval, we obviously have a 100% uptime for the VM.
Line 48: Based on the value the script calculates in which metric the power on of the VM occurred. This avoids the script has to look at each returned metric.
Line 51: As long as we are within the requested interval we keep adding the values to the uptime.
Line 52: When a VM was powered off and is not immediatly powered on again, there are metrics that have a value of 1. This condition avoids adding these metrics to the total uptime.
Line 59: To calculate how much of the total uptime of the metric can be attributed to the requested interval, the script substracts the value from the next metric.
Line 68-74: The object that holds the uptime information is constructed.
Line 77-83: When there are no metrics found for a specific VM, the value property will say “no data”
Sample Usage
The simplest form to call the Get-VMUptime function would be something similar to this
|
1 2 3 |
$vm = Get-VM MyVM Get-VMUptime -VM $vm |
This will return 1 object with the Uptime property showing the percentage.

So that VM was available all the time during the last 7 days.
Let’s go back a bit further in time
|
1 2 3 |
$vm = Get-VM MyVM Get-VMUptime -VM $vm -Start (Get-Date).AddDays(-25) |
There goes the 100%.

The explanation for the drop in the Uptime percentage is the monthly patch cycle of a Windows OS.
You can make the driving script a bit more complex. The following will calculate monthly uptime percentages for a number of VMs. Note that the script uses 11 months, since we were still in December when I ran the script 😉
|
1 2 3 4 5 6 7 8 9 10 11 12 |
$yearStart = Get-Date -Day 1 -Month 1 -Year 2012 -Hour 0 -Minute 0 -Second 0 $months = 11 $vms = Get-VM VM* &{0..($months-1) | %{ $start = $yearStart.AddMonths($_) $finish = $start.AddMonths(1).AddSeconds(-1) Get-VMUptime -VM $vms -Start $start -Finish $finish }} | Export-Csv C:\uptime.csv -NoTypeInformation -UseCulture |
The resulting CSV file looks something like this.
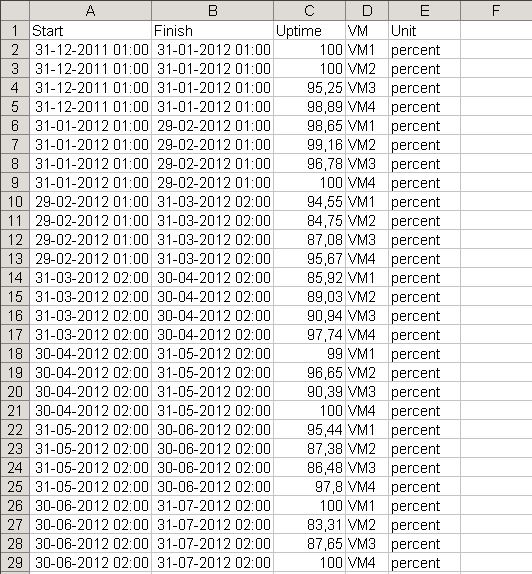
Note that the Start and Finish dates are not the nice round values we requested in the script. The reason for this are the aggregation jobs that run regularly and “aggregate” the metrics. In the example above it is clear that the aggregation jobs run at 01:00 local time in January and February and then at 02:00 local time later on. The reason for this change in the time was an upgrade of vCenter in the month of February.
Since we ultimately (Historical Interval 4) only have 1 metric per day, there is no point in trying to get round these timestamps in the report. The effort involved wouldn’t justify this in my opinion.
To clarify further, this is from my test environment. My production environment doesn’t have such lousy uptime values (most of the time) 😎
Word of warning: I think the script covers all the possible cases I encountered in my environment, but it is of course possible that you could see some “off” percentages. An Uptime of more than 100% looks nice, but obviously indicates an error in the script. So do values that are definitely too low.
If you encounter such strange Uptime values let me know. It would be handy if you could send me the sys.uptime.latest values and the timestamps for the incorrect time interval in such a case.
Enjoy !
Dennis
LucD,
awesome script! One question though: How can I get the monthly to show more than 2 decimal points? Ideally, I’d like to see at least 4.
LucD
Hi Dennis,
Replace this line
Uptime = [math]::Round(($totalUptime / ($numberOfSamples * $intervalDuration) * 100),2)
with this line
Uptime = [math]::Round(($totalUptime / ($numberOfSamples * $intervalDuration) * 100),4)
The second parameter to the Round method defines how many decimal places.
Black Lion
Basic noob user here. please, would you tell me exactly the easiest way to use this? I’m trying this:
$vms=Get-VM
foreach ($vm in $vms)
{
Get-VMUptime -VM $vm
}
but everytime it comes out blank. I’m also doing “Get-VMUptime -VM “MyVmName” and it comes out blank too. Looks like the script does nothing. I’m doing something wrong but I don’t know what 🙁
Thanks.
Nick
Hi Lucd,
Thank you for this script.
I’m not proficient with powershell, and when i try to run this i get this error
Could not compare “02/03/2016 11:43:59” to “-00:00:20”. Error: “Cannot convert the “-00:00:20” value of type “System.TimeSpan” to type “System.DateTime”.”
At Z:\downtime.ps1:45 char:12
+ if(($_.Group[0].Timestamp – $uptime) -le $startInterval){
+ ~~~~~~~~~~~~~~~~~~~~~~~~~~~~~~~~~~~~~~~~~~~~~~~~~~~~
+ CategoryInfo : InvalidOperation: (:) [], RuntimeException
+ FullyQualifiedErrorId : ComparisonFailure
Start : -00:00:20
Finish : 2/26/2016 3:29:20 PM
Uptime : 0
Unit : percent
VM : myServer
LucD
Hi Nick,
How did you call the Get-VMUptime function ?
By default the function looks over the last 7 days. Did you specify another Start and/or Finish ?
Is there statistical data for that VM for the timerange ? You can check by looking at the Performance tab in the WEB or vSphere Client.
Black Lion
Hello LUCD. I have the same problem.
Look, here’s what I’ve done:
PowerCLI C:\Scripts>
PowerCLI C:\Scripts>
PowerCLI C:\Scripts> Import-Module .\Get-VMUptime.ps1
PowerCLI C:\Scripts> Get-VMUptime -VM PPSD
PowerCLI C:\Scripts>
blank. Every single time. The VM exist. I’ve also did query with get-vm to make an array for all my vms and got the same result: blank.
Can you please help me?
Thanks a lot!
Fernando
Same problem over here. Didn’t touch a thing: Get-VmUptime – VM “MyVm”.
LucD
I assume the problem was fixed by adapting the Statistics Levels ?
Ruffin
Boy, I tell you what, these sys.uptime.latest values seem not to be exceptionally well calibrated. I’ve got swings of thirty minutes or more for each reading when the granularity is 24 hours. Though the swings usually correct the other way with the next few readings, if your last reading is on one of the long tails of that swing, your uptime can be off by quite a bit.
Here’s an example:
MetricId Timestamp Value Unit Instance
sys.uptime.latest 11/30/2014 7:00:00 PM 26113 second
sys.uptime.latest 11/29/2014 7:00:00 PM 722075 second
sys.uptime.latest 11/28/2014 7:00:00 PM 636279 second
sys.uptime.latest 11/27/2014 7:00:00 PM 548383 second
sys.uptime.latest 11/26/2014 7:00:00 PM 461387 second
sys.uptime.latest 11/25/2014 7:00:00 PM 375890 second
sys.uptime.latest 11/24/2014 7:00:00 PM 290694 second
sys.uptime.latest 11/23/2014 7:00:00 PM 202198 second
sys.uptime.latest 11/22/2014 7:00:00 PM 117901 second
sys.uptime.latest 11/21/2014 7:00:00 PM 30005 second
sys.uptime.latest 11/20/2014 7:00:00 PM 1705754 second
…
So if you look at 11/21 and 11/22, the time between the two values is 87896, which is 1496 seconds *LONGER* than the 86400 seconds between the two timestamps. Going to 11/23, we swing the other way. The difference is 84297, 2103 seconds *under* one day of seconds. We’ve *more* than made up the impossible inaccuracy of the earlier reading. (That’s not the script’s fault, obviously; it speaks to the accuracy of Get-Stat -Entity $VM -Stat “sys.uptime.latest”.
Again, in my limited experience, the sum of these “inaccurate” values trends towards 0, but unless I’m missing something, believing any particular Value is accurate is a real crapshoot, and this script biases the “max” value before a reboot, which can make for some strange edge cases.
It would seem better to take the difference between the first timestamp after a reboot (as on 11/21 and 11/30, above), find the difference between that and a full day of uptime (86400), and call that the working, but likely over-estimated, down-time, imo. You could still be misrepresenting the downtime by some value, but you will confidently no longer receive over 100% uptime values (which I have gotten running the script). Take the expected maximum uptime and subtract those gaps on each uptime restart.
You might perform some QA to make sure the max uptime values are close to their theoretical maxes, but I haven’t seen that be a real serious problem. That is, readings are usually less than 4-5% away from what “should” be happening; the problem doesn’t compound itself.
LucD
Great observation.
I suspect this might be related to the timestamps and the aggregation jobs.
The aggregation job has a rather simplistic way of determining if an interval belongs to “aggregated interval n” or “aggregated interval n+1”.
The best solution would be to use the Realtime samples, and do the aggregation yourself.
Then, instead of comparing 2 timestamps, one could decide if a measurement belong to one or the other aggregated interval, based on for example which percentage of the measurement interval belongs to one or the other aggregated interval.
Or even better, spread the measurement proportionally over both aggregated intervals.
Definitely room for improvement 🙂
Gert Van Gorp
Hi Luc,
Nice script. Thnka for this.
Small question, is there a way to specify I only want the uptime between business hours?
Thanks
Gert
LucD
Gert,
Not on the Get-Stat cmdlet itself I’m afraid.
But you can add a Where-clause after the Get-Stat line, something like I did in my PowerCLI & vSphere statistics – Part 2 – Come together post in the 2nd script.
Max
Hi Lucd,
hm not understand the Condition 100%.
So once i shutdown vm’s and make backward check of the Availibilty through vCenter > then i have in the “Costum 2 Days” overview Informations from the “Sys.uptime.latest” (the statistic 4 Level is rather to I/O Intensive)
so but if i run the script > i don’t see Infos.
So how i could change the Script to see the correct Uptime? ;(
thx
Max
Ram
Hi LucD,
Thanks for the monthly vms uptime report.
I have 200 VMS in my vCenter .My question is ..I need to add all the VMs name in the scripts or no need to VM name ?I can see two scripts for monthly report..which script I have to use ..or can send a single script for monthly VM uptime?
Thanks
LucD
Hi Ram, there are 2 parts in that post.
The first is the Get-VMUptime function, the 2nd are some samples on how you can use the function.
In your case you could do
Get-VM | Get-VMUptime
You can “pipe” the VMs to the function, and since we call the function by it’s defaults, it will look at the uptime for the last 7 days.
The complete script could be in a .ps1 file.
First copy in the function itself, then at the end of the line the actual call to the function (the sample line I just gave for example).
Does that make it any clearer ?
Ane
Hi LucD,
I tried your script, want to create some monthly report, so far works great with the default 7 days window, but I’ve noticed that If I change the time interval > 7days the command hangs for 1/3 of the VM’s even if they already have performance data starting from the beginning of the interval and are already up for several months..
Any thought, what can be the issue?
Thanks in advance.
Cheers,
Ane
LucD
@Ane, what exactly do you mean with “…command hangs for 1/3 of the VM’s” ?
Is the script hanging, or does it not produce output for 1/3 of your VMs ?
In bigger environmens, the PowerShell session can run out of memory. I have seen that with other scripts as well. What number of VMs are we talking about 100s, 1000s, 10000s….?
For bigger environments you are probably better of running the script multiple times, each time for a different set of your VMs.
David
Hi LucD,
I tried out your Get-VMUptime script and it only reports against 4 VM’s in the environment, appears to loop through the same 4 VM’s for different date ranges.
I’ve got 4 hosts here with 23 VM’s on them. If I try changing $vms = Get-VM MyVM to $vms = Get-VM *, or $vms = Get-VM “vm1″,”vm2” etc. it still only reports against 4 VM’s.
David
LucD
@David, are there performance metrics available for all VMS ? And more specifically at the beginning of the period which you selected ?
The Get-Stat cmdlet skips collection data for a VM when it finds no performance data at the beginning of the requested interval.
A good way to check if there is data, is by selecting the Performance tab for that VM in the vSphere client, and selecting the same time interval as you did in the script.
Markus
Hi Lucd,
Interesting Script.
Once Question. the Percente Overview is ok.
But how could i implement a overview how long a VPS is running?.
So let’s say based on that output.
Start = 30.11.2012
Finish = 25.12.2012
For this Amount of Days > how could i implement a Field “UpHours”
so to see how many days a VM is/was online during that Area.
so the “latest” Counter gives me only the whole amount – so but don’t know how to Fix to only to a specified Time Area
thx
Markus